FabCon is coming to Atlanta
Join us at FabCon Atlanta from March 16 - 20, 2026, for the ultimate Fabric, Power BI, AI and SQL community-led event. Save $200 with code FABCOMM.
Register now!- Power BI forums
- Get Help with Power BI
- Desktop
- Service
- Report Server
- Power Query
- Mobile Apps
- Developer
- DAX Commands and Tips
- Custom Visuals Development Discussion
- Health and Life Sciences
- Power BI Spanish forums
- Translated Spanish Desktop
- Training and Consulting
- Instructor Led Training
- Dashboard in a Day for Women, by Women
- Galleries
- Data Stories Gallery
- Themes Gallery
- Contests Gallery
- QuickViz Gallery
- Quick Measures Gallery
- Visual Calculations Gallery
- Notebook Gallery
- Translytical Task Flow Gallery
- TMDL Gallery
- R Script Showcase
- Webinars and Video Gallery
- Ideas
- Custom Visuals Ideas (read-only)
- Issues
- Issues
- Events
- Upcoming Events
Get Fabric Certified for FREE during Fabric Data Days. Don't miss your chance! Request now
- Power BI forums
- Forums
- Get Help with Power BI
- Desktop
- Re: Barchart with aggregation
- Subscribe to RSS Feed
- Mark Topic as New
- Mark Topic as Read
- Float this Topic for Current User
- Bookmark
- Subscribe
- Printer Friendly Page


- Mark as New
- Bookmark
- Subscribe
- Mute
- Subscribe to RSS Feed
- Permalink
- Report Inappropriate Content
Barchart with aggregation
Hi,
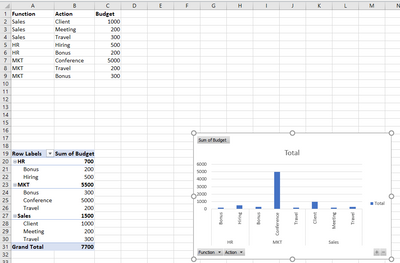
in Excel I was able, from a simple file with 2 levels, to create a bar chart were one of the levels were aggregated, using a Pivot table please see example below.
Is there any chance to do that in power BI? I was not able to reproduce it
Solved! Go to Solution.


- Mark as New
- Bookmark
- Subscribe
- Mute
- Subscribe to RSS Feed
- Permalink
- Report Inappropriate Content
Hi, @Lobojo
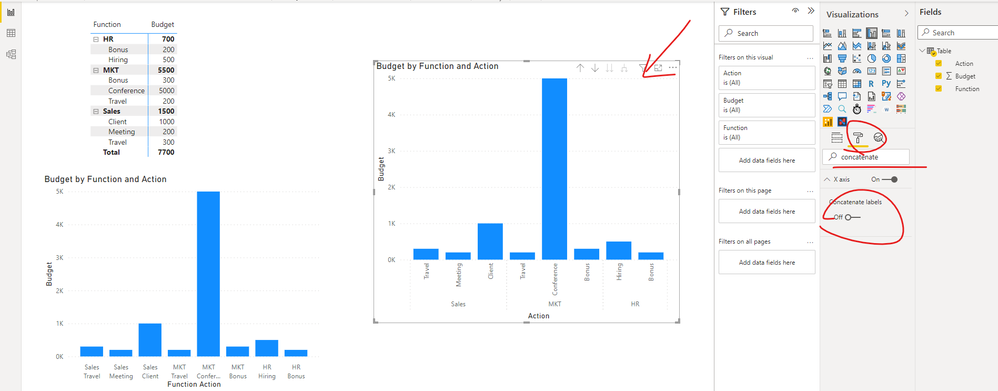
You need go to the "Format" pane of the "clustered column chart" and turn off the option "Concatenate labels".
Best Regards,
Community Support Team _ Eason
- Mark as New
- Bookmark
- Subscribe
- Mute
- Subscribe to RSS Feed
- Permalink
- Report Inappropriate Content
Hi, @Lobojo
You need go to the "Format" pane of the "clustered column chart" and turn off the option "Concatenate labels".
Best Regards,
Community Support Team _ Eason


- Mark as New
- Bookmark
- Subscribe
- Mute
- Subscribe to RSS Feed
- Permalink
- Report Inappropriate Content
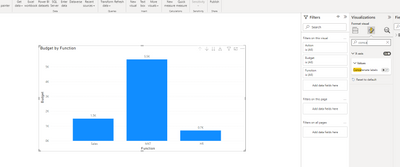
@v-easonf-msft I tried to do the same as you mentioned in your snapshot. Could you please tell me why doesn't it work with May 2022 version of Power BI desktop? Am I missing something here ?
- Mark as New
- Bookmark
- Subscribe
- Mute
- Subscribe to RSS Feed
- Permalink
- Report Inappropriate Content
Hi, @ghoshabhijeet
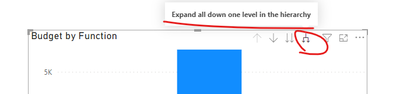
You need to expand all down one level in the hierarchy.
Best Regards,
Community Support Team _ Eason
- Mark as New
- Bookmark
- Subscribe
- Mute
- Subscribe to RSS Feed
- Permalink
- Report Inappropriate Content
Thanks a lot, it worked with a stacked column graph but not with another stacked column (nothing happened). You possibly know why? They are quite the same type of visual, I don't know if there is any element that prevent the usage of this feature
- Mark as New
- Bookmark
- Subscribe
- Mute
- Subscribe to RSS Feed
- Permalink
- Report Inappropriate Content
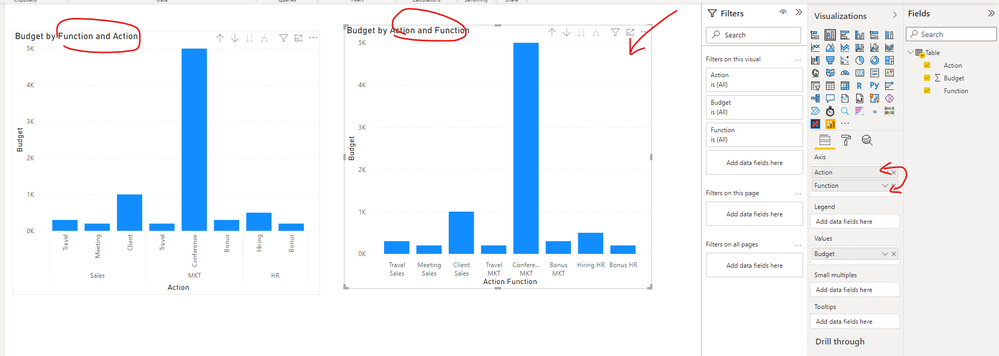
Hi, @Lobojo
This has something to do with the ordering of the fields you add on your axis.
For example:
Best Regards,
Community Support Team _ Eason
- Mark as New
- Bookmark
- Subscribe
- Mute
- Subscribe to RSS Feed
- Permalink
- Report Inappropriate Content
Very strange, it doesn't work either changing the order. Let me try to do few test.
Anyway, thanks a lot.
- Mark as New
- Bookmark
- Subscribe
- Mute
- Subscribe to RSS Feed
- Permalink
- Report Inappropriate Content
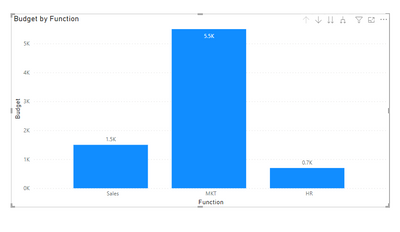
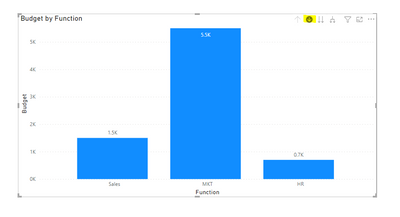
@Lobojo I would then suggest you to use the Drill Down feature. You can keep the chart to the top most value in X-Axis. When the user would like to see the values under it, they may drill down and see Action values for the respective Function.
Snapshot below:
1. Initially your chart would be at the top level
2. If the user wants to drill down, they need to select the highlighted button and drill down on their respective Function

Hope this solution works for you.
** If you liked my solution, please give it a thumbs up. And if I did answer your question, please mark this post as a solution, so that it comes in top of the search and help others. Thank you ! Good Luck 👍 |
- Mark as New
- Bookmark
- Subscribe
- Mute
- Subscribe to RSS Feed
- Permalink
- Report Inappropriate Content
Thanks, but this not what I was looking for. I need a full overview, not function by function. Anyway thanks a lot for your time.
- Mark as New
- Bookmark
- Subscribe
- Mute
- Subscribe to RSS Feed
- Permalink
- Report Inappropriate Content
@Lobojo Thanks for sharing your query.
In Power BI we don't have the option to show the groupings in the X-Axis like you have done in excel. However, you can achive something like this. Hope this works for you.

To achieve this:
1. You can put the Function and Action on the X-Axis and Budget on the Y-Axis
2. Click on the highlighted button on the chart
** If you liked my solution, please give it a thumbs up. And if I did answer your question, please mark this post as a solution, so that it comes in top of the search and help others. Thank you ! Good Luck 👍 |
- Mark as New
- Bookmark
- Subscribe
- Mute
- Subscribe to RSS Feed
- Permalink
- Report Inappropriate Content
Thanks but my request was to "group" the text of "function" because in my real database the names of function and action are very long and cannot be cut.

Helpful resources

Power BI Monthly Update - November 2025
Check out the November 2025 Power BI update to learn about new features.

Fabric Data Days
Advance your Data & AI career with 50 days of live learning, contests, hands-on challenges, study groups & certifications and more!

FabCon Atlanta 2026
Join us at FabCon Atlanta, March 16-20, for the ultimate Fabric, Power BI, AI and SQL community-led event. Save $200 with code FABCOMM.


