New Offer! Become a Certified Fabric Data Engineer
Check your eligibility for this 50% exam voucher offer and join us for free live learning sessions to get prepared for Exam DP-700.
Get Started- Power BI forums
- Get Help with Power BI
- Desktop
- Service
- Report Server
- Power Query
- Mobile Apps
- Developer
- DAX Commands and Tips
- Custom Visuals Development Discussion
- Health and Life Sciences
- Power BI Spanish forums
- Translated Spanish Desktop
- Training and Consulting
- Instructor Led Training
- Dashboard in a Day for Women, by Women
- Galleries
- Community Connections & How-To Videos
- COVID-19 Data Stories Gallery
- Themes Gallery
- Data Stories Gallery
- R Script Showcase
- Webinars and Video Gallery
- Quick Measures Gallery
- 2021 MSBizAppsSummit Gallery
- 2020 MSBizAppsSummit Gallery
- 2019 MSBizAppsSummit Gallery
- Events
- Ideas
- Custom Visuals Ideas
- Issues
- Issues
- Events
- Upcoming Events
Don't miss out! 2025 Microsoft Fabric Community Conference, March 31 - April 2, Las Vegas, Nevada. Use code MSCUST for a $150 discount. Prices go up February 11th. Register now.
- Power BI forums
- Forums
- Get Help with Power BI
- Desktop
- Average with ALL/ALLEXCEPT returning wrong value
- Subscribe to RSS Feed
- Mark Topic as New
- Mark Topic as Read
- Float this Topic for Current User
- Bookmark
- Subscribe
- Printer Friendly Page
- Mark as New
- Bookmark
- Subscribe
- Mute
- Subscribe to RSS Feed
- Permalink
- Report Inappropriate Content
Average with ALL/ALLEXCEPT returning wrong value
Hello all,
I'm trying to calculate an average value with some ALL and ALLEXCEPT filters but the value being returned is incorrect and I don't know why.
I have data with suppliers and job types. I want to take the average cost for the job type, regardless of supplier and compare that to the average cost of the job type across the network.
To do that, I've wrote the following measure:
I THINK this is right but I'll be honest and admit that I'm terrible with the ALL and ALLEXCEPT forumlas.
The reulst in the table is half right:
Whilst the Average Job Type Case figure is right (I think) the total number is different, which does not make sense to me. I am then calculating the percentage difference between the Total Spend and Average Job Type Cost and whilst this is returning correctly in the table, again, once it totals up, it's taking the total number.
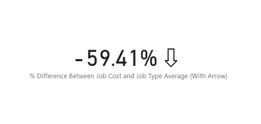
When I then look to return this to a measure on its own, it's taking the total (and therefore) incorrect figure:
I'm 99% certain this is me amking a mistake with the ALLEXCEPT forumla but no matter what changes I try (switiching it to ALL and changing the average function) I can't seem to fix it.
I COULD create calaculated colums and return the selected value but that's only going to slow my report down in the long run and it seems clumsy.
Can someone please advise where I may be going wrong?
Thank you.
- Mark as New
- Bookmark
- Subscribe
- Mute
- Subscribe to RSS Feed
- Permalink
- Report Inappropriate Content
Hi, @SamFletch
Could you please tell me whether your problem has been solved?
For now, there is no content of description in the thread. If you still need help, please share more details to us.
Best Regards,
Community Support Team _ Eason
- Mark as New
- Bookmark
- Subscribe
- Mute
- Subscribe to RSS Feed
- Permalink
- Report Inappropriate Content
Hi, @SamFletch
I create a sample file,but didn't find anything wrong.
I guess that you may missing some filter conditions in measure Average Job Type Cost . If possible , can you share your sample data/pbix file for testing?
How will the table visual display if you only apply the field "Job type" and "Average Job Type Cost " to the table "Values" ?
Best Regards,
Community Support Team _ Eason
- Mark as New
- Bookmark
- Subscribe
- Mute
- Subscribe to RSS Feed
- Permalink
- Report Inappropriate Content
Hi @SamFletch
Do one thing use this Dax to calculate the average = averagex(allselected(supplier),total cost). This will give you the result.
Kindly mark this solution as accepted.
Helpful resources

Join us at the Microsoft Fabric Community Conference
March 31 - April 2, 2025, in Las Vegas, Nevada. Use code MSCUST for a $150 discount!

Power BI Monthly Update - January 2025
Check out the January 2025 Power BI update to learn about new features in Reporting, Modeling, and Data Connectivity.

| User | Count |
|---|---|
| 124 | |
| 79 | |
| 50 | |
| 38 | |
| 38 |
| User | Count |
|---|---|
| 196 | |
| 80 | |
| 70 | |
| 51 | |
| 42 |


