FabCon is coming to Atlanta
Join us at FabCon Atlanta from March 16 - 20, 2026, for the ultimate Fabric, Power BI, AI and SQL community-led event. Save $200 with code FABCOMM.
Register now!- Power BI forums
- Get Help with Power BI
- Desktop
- Service
- Report Server
- Power Query
- Mobile Apps
- Developer
- DAX Commands and Tips
- Custom Visuals Development Discussion
- Health and Life Sciences
- Power BI Spanish forums
- Translated Spanish Desktop
- Training and Consulting
- Instructor Led Training
- Dashboard in a Day for Women, by Women
- Galleries
- Data Stories Gallery
- Themes Gallery
- Contests Gallery
- QuickViz Gallery
- Quick Measures Gallery
- Visual Calculations Gallery
- Notebook Gallery
- Translytical Task Flow Gallery
- TMDL Gallery
- R Script Showcase
- Webinars and Video Gallery
- Ideas
- Custom Visuals Ideas (read-only)
- Issues
- Issues
- Events
- Upcoming Events
Get Fabric Certified for FREE during Fabric Data Days. Don't miss your chance! Request now
- Power BI forums
- Forums
- Get Help with Power BI
- Desktop
- Alternative to merging large table - Need null val...
- Subscribe to RSS Feed
- Mark Topic as New
- Mark Topic as Read
- Float this Topic for Current User
- Bookmark
- Subscribe
- Printer Friendly Page
- Mark as New
- Bookmark
- Subscribe
- Mute
- Subscribe to RSS Feed
- Permalink
- Report Inappropriate Content
Alternative to merging large table - Need null values in a table
Hello,
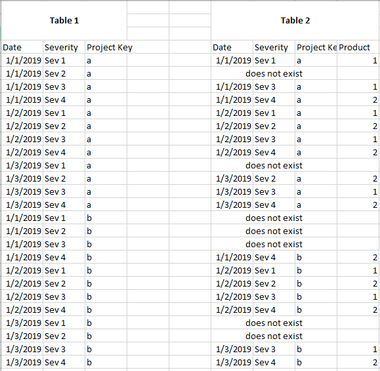
I want to create Table 1 (see below) and eventually join it with Table 2.
I want to create table 1 with the following fields:
- Dates from 1/1/2019 - 12/31/2019
- Severities
- Severity 1 - Critical
- Severity 2 - Major
- Severity 3 - Minor
- Severity 4 - Trivial
- Project Key (290 project keys)
Where I could start: I have all 3 of the folllowing fields, but in separate tables. I want to merge them all into a table to look like the photo above.
I expect this table to be ginormous. The reason for this table is to perform a join with Table 2, so that I can get empty (null values) in a new table (see below)
Reason being is so that I can change those null values to a zero and compute a calculation.
Please help!
Solved! Go to Solution.
- Mark as New
- Bookmark
- Subscribe
- Mute
- Subscribe to RSS Feed
- Permalink
- Report Inappropriate Content
@Anonymous ,
Refer this post:
Thanks,
Tejaswi
- Mark as New
- Bookmark
- Subscribe
- Mute
- Subscribe to RSS Feed
- Permalink
- Report Inappropriate Content
Hi @Anonymous ,
Please let me know if these steps works for you:
1. Hit on new table( in the modeling) and enter this formulas( (or you can simply hit on enter data and enter the values you want)
- Table 1 : ( I am adding blank columns so that I can merge it with table 2, since table 2 has 4 columns)
Table 1 = Union(
     Row("Date","1/1/2019","severity","sev1","project key","a"," ",""),
Row("Date","1/1/2019","severity","sev2","project key","a"," ",""),
Row("Date","1/1/2019","severity","sev3","project key","a"," ",""),
Row("Date","1/1/2019","severity","sev4","project key","a"," ",""),
Row("Date","1/1/2019","severity","sev1","project key","b"," ",""),
Row("Date","1/1/2019","severity","sev2","project key","b"," ",""))
-Table 2:
Table2 = Union(
     Row("Date","1/1/2019","severity","sev1","project key","a","Product","1"),
Row("Date","1/1/2019","severity","sev3","project key","a","Product","1"),
Row("Date","1/1/2019","severity","sev4","project key","a","Product","2"))
-Table 3-( Merge Table 1 and Table 2)
Just add table 2 after Union in your Table 1 formula.This will merge the data you need.
Table 1 = Union( Table2,
     Row("Date","1/1/2019","severity","sev1","project key","a"," ",""),
Row("Date","1/1/2019","severity","sev2","project key","a"," ",""),
Row("Date","1/1/2019","severity","sev3","project key","a"," ",""),
Row("Date","1/1/2019","severity","sev4","project key","a"," ",""),
Row("Date","1/1/2019","severity","sev1","project key","b"," ",""),
Row("Date","1/1/2019","severity","sev2","project key","b"," ",""))
- Here is what I got as an output:
Highlighted sev 2 has Product key null. same as what you expected.
Let me know for any question,
Thanks,
Tejaswi
- Mark as New
- Bookmark
- Subscribe
- Mute
- Subscribe to RSS Feed
- Permalink
- Report Inappropriate Content
I already have the tables for Date, Severity, and Project Key.
I just need a method to join all 3 together.
- Mark as New
- Bookmark
- Subscribe
- Mute
- Subscribe to RSS Feed
- Permalink
- Report Inappropriate Content
@Anonymous
May be you can use Merge queries in the query editor.
Thanks,
Tejaswi
- Mark as New
- Bookmark
- Subscribe
- Mute
- Subscribe to RSS Feed
- Permalink
- Report Inappropriate Content
Can I merge (join) if they do not share a common primary key?
- Mark as New
- Bookmark
- Subscribe
- Mute
- Subscribe to RSS Feed
- Permalink
- Report Inappropriate Content
@Anonymous ,
Refer this post:
Thanks,
Tejaswi
- Mark as New
- Bookmark
- Subscribe
- Mute
- Subscribe to RSS Feed
- Permalink
- Report Inappropriate Content
Hello @Anonymous
You can use the CROSSJOIN function to generate a table. Something like.
Big Table =
VAR Severities = DATATABLE("Severity",STRING,{{"Severity 1 - Critical"},{"Severity 2 - Major"},{"Severity 3 - Minor"},{"Severity 4 - Trivial"}})
VAR FirstJoin = CROSSJOIN ( Severities, VALUES('Projects'[Project Key]))
RETURN CROSSJOIN (FirstJoin,Dates[date])
- Mark as New
- Bookmark
- Subscribe
- Mute
- Subscribe to RSS Feed
- Permalink
- Report Inappropriate Content
thank you this worked.
Helpful resources

Power BI Monthly Update - November 2025
Check out the November 2025 Power BI update to learn about new features.

Fabric Data Days
Advance your Data & AI career with 50 days of live learning, contests, hands-on challenges, study groups & certifications and more!


