Forum Discussion
Allow users to select visual type in the report
Hi pradeepiqss,
I'm happy to help but I am having trouble fully understanding your needs..
Can you post images displaying what is now happening and what you would want to happen when a button is clicked?
Br,
T
Hi,
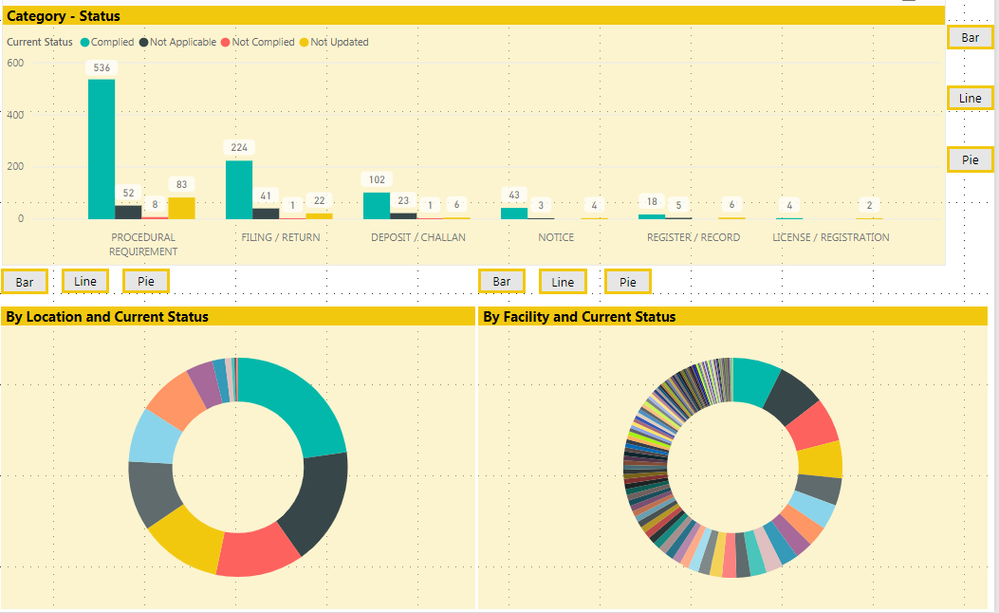
In the report page i have 3 visuals with 1st visual - bar, 2nd visual - Pie and 3rd visual, see screenshot below:
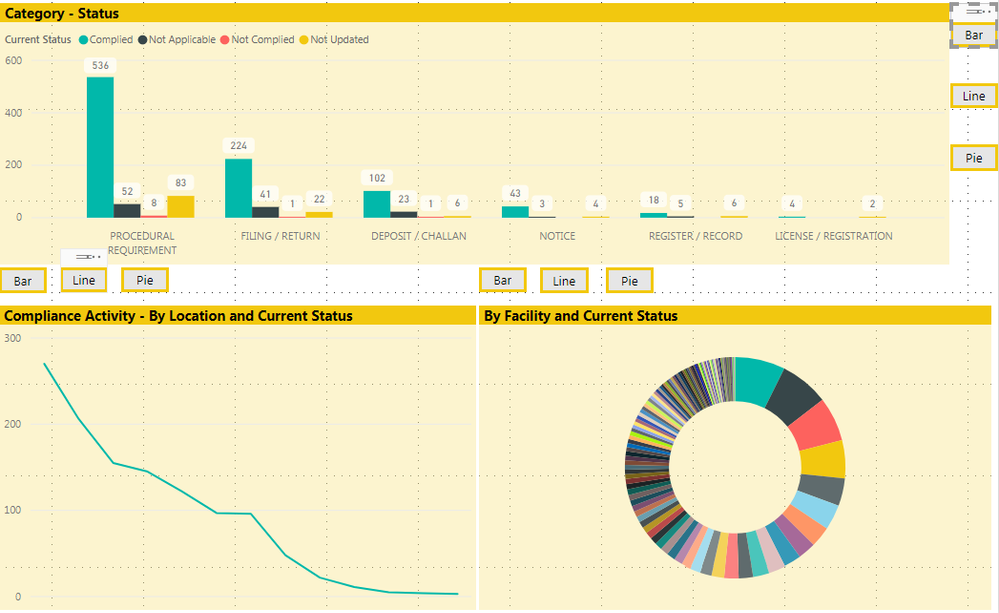
When i click on 'Line' button for 2nd visual, it changes to line chart, see screenshot below:
Next, when click on 'Pie' button in 1st visual, the 2nd visual which was showing line graph changes or resets back to Pie chart, see screenshot below:
I tried by updating a bookmark with 'selected visual' option for buttons related to 1st visual at the top of page, but still does not work.
- Anonymous8 years agoNot applicable
Hi pradeepiqss,
I duplicated your report and tried to get it working but unfortunately to no success... I don't think it is possible to keep the other visuals from changing back to their default, because that would mean your bookmarks would have to dynamically change based on the visuals "selected".
I'm afraid I can't help. Maybe you can try changing your report so that there's only one visual selection per page or then make do with what you got.
Br,
T