- Subscribe to RSS Feed
- Mark Topic as New
- Mark Topic as Read
- Float this Topic for Current User
- Bookmark
- Subscribe
- Printer Friendly Page
- Mark as New
- Bookmark
- Subscribe
- Mute
- Subscribe to RSS Feed
- Permalink
- Report Inappropriate Content

Allocate Man hour equally
I have a table like following, I need to allocate the man hour equally to each day, and then calculate the man hour of each staff per month
Pls help, thank you very much in advance
Solved! Go to Solution.
- Mark as New
- Bookmark
- Subscribe
- Mute
- Subscribe to RSS Feed
- Permalink
- Report Inappropriate Content

Seems like a combination of:
https://community.powerbi.com/t5/Quick-Measures-Gallery/Periodic-Revenue-Reverse-YTD/m-p/373185#M111
And
https://community.powerbi.com/t5/Quick-Measures-Gallery/Open-Tickets/td-p/409364
Follow on LinkedIn
@ me in replies or I'll lose your thread!!!
Instead of a Kudo, please vote for this idea
Become an expert!: Enterprise DNA
External Tools: MSHGQM
YouTube Channel!: Microsoft Hates Greg
Latest book!: Power BI Cookbook Third Edition (Color)
DAX is easy, CALCULATE makes DAX hard...
- Mark as New
- Bookmark
- Subscribe
- Mute
- Subscribe to RSS Feed
- Permalink
- Report Inappropriate Content

HI @hongyuliu,
I'm not so sure what you mean, can you please share some expected results to help us clarify your requirement?
In addition, if you mean expand these date range and summary daily man hour and calculate the average man-hour based on daily total and staff count.
You can create a calculated table to expand date range and link with staffs, then you can create a visual with date as axis and aggregate staff cont as value.
Expand =
SELECTCOLUMNS (
    FILTER (
        CROSSJOIN (
            'Table',
            CALENDAR ( MIN ( 'Table'[Date From] ), MAX ( 'Table'[Date To] ) )
        ),
        [Date] >= [Date From]
            && [Date] <= [Date To]
    ),
    "Staff", [Staff],
    "Date", [Date]
)
Spread revenue across period based on start and end date, slice and dase this using different dates
Regards,
Xiaoxin Sheng
If this post helps, please consider accept as solution to help other members find it more quickly.
- Mark as New
- Bookmark
- Subscribe
- Mute
- Subscribe to RSS Feed
- Permalink
- Report Inappropriate Content

Hi
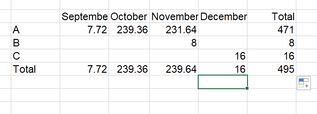
I need to calculate how many hours one staff has worked in a month. For example, Staff A started working on Sep 30, finishing on Nov 30, totaly working 471 hours in 60 days. Then 471/60= 7.85 hour/day. In september, Staff A has worked 7.85 hours. I just dont' know how to write the formula.
my original data table is like this
Result should be like this, if I create a Matrix in Power BI
Thank you very much for your help.
- Mark as New
- Bookmark
- Subscribe
- Mute
- Subscribe to RSS Feed
- Permalink
- Report Inappropriate Content

Seems like a combination of:
https://community.powerbi.com/t5/Quick-Measures-Gallery/Periodic-Revenue-Reverse-YTD/m-p/373185#M111
And
https://community.powerbi.com/t5/Quick-Measures-Gallery/Open-Tickets/td-p/409364
Follow on LinkedIn
@ me in replies or I'll lose your thread!!!
Instead of a Kudo, please vote for this idea
Become an expert!: Enterprise DNA
External Tools: MSHGQM
YouTube Channel!: Microsoft Hates Greg
Latest book!: Power BI Cookbook Third Edition (Color)
DAX is easy, CALCULATE makes DAX hard...
- Mark as New
- Bookmark
- Subscribe
- Mute
- Subscribe to RSS Feed
- Permalink
- Report Inappropriate Content

Helpful resources

Join us at the Microsoft Fabric Community Conference
March 31 - April 2, 2025, in Las Vegas, Nevada. Use code MSCUST for a $150 discount!

Power BI Monthly Update - February 2025
Check out the February 2025 Power BI update to learn about new features.

| Subject | Author | Posted | |
|---|---|---|---|
| 10-02-2021 03:51 AM | |||
| 02-15-2025 02:23 PM | |||
|
Anonymous
| 09-30-2020 11:02 AM | ||
| 07-14-2021 12:47 PM | |||
| 02-26-2025 05:24 AM |
| User | Count |
|---|---|
| 83 | |
| 78 | |
| 52 | |
| 37 | |
| 36 |
| User | Count |
|---|---|
| 104 | |
| 85 | |
| 47 | |
| 44 | |
| 43 |


