This is best Fabric, Power BI, SQL and AI community event. How do we know? The last event sold out! Save €200 with code FABCMTY200.
Register nowA new Data Days event is coming soon! This time we’re going bigger than ever. Fabric, Power BI, SQL, AI and more. Don't miss out.
Hello All,
A really strange behavior...
I have a table where one column is calculated -->
Vacancy = 'Table1'[columnA] -
COUNTROWS(FILTER(RELATEDTABLE('Table2'),'Table2'[isDeleted] = FALSE()))This column shows me the correct numbers for each record.
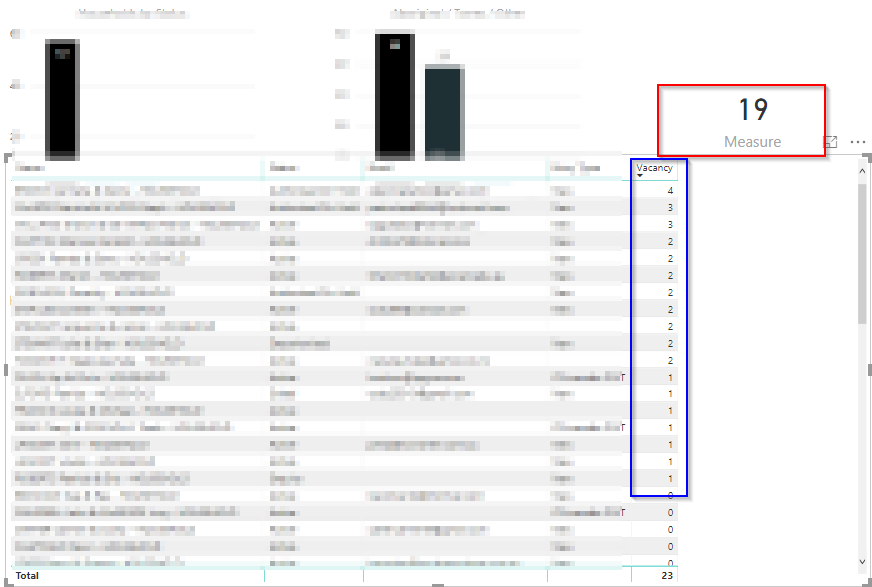
I created a measure to count these rows where Vacancy > 0 -->
Measure = COUNTROWS(FILTER('Table1','Table1'[Vacancy] > 0))This shows me 19 where in the original table there are 18 rows that answer the filter condition.
How is that possible?
Solved! Go to Solution.
Solution.
I found that in my calculated column I have NULL values.
So I was trying to substruct NULLS. i.e. NULL - n.
This caused the records not to show.
I fixed it by writing a 'IFNULL'=0 function in my original query and now I can see all records again.
Cheers!
Solution.
I found that in my calculated column I have NULL values.
So I was trying to substruct NULLS. i.e. NULL - n.
This caused the records not to show.
I fixed it by writing a 'IFNULL'=0 function in my original query and now I can see all records again.
Cheers!
New Finding.
I found that 3 records is missing from the table.
So, in the original table in the MySQL DB I have 62 records and the visualization shows me 59 records.
I have a page level filter which is working fine.
Other visualizations show correct number of rows.
How is that possible?
Having X in the original table and X-n in the visualization table?
Thanks
A
Hi @Anonymous,
Are there some duplicate records in original table? If so, when you add them to table visual, duplicates will appear only once. Besides, please remove aggregation of all fields in table visual, and check the output again.
Regards,
Yuliana Gu
Thanks for the reply.
I do not have duplicates in the origianl table.
Each record has a unique id.
There are no aggregations in the table visual.
Thanks!
A
Check out the May 2026 Power BI update to learn about new features.
Sign up to receive a private message when registration opens and key events begin.
If you have recently started exploring Fabric, we'd love to hear how it's going. Your feedback can help with product improvements.
| User | Count |
|---|---|
| 31 | |
| 26 | |
| 25 | |
| 22 | |
| 13 |
| User | Count |
|---|---|
| 58 | |
| 50 | |
| 26 | |
| 20 | |
| 19 |