FabCon is coming to Atlanta
Join us at FabCon Atlanta from March 16 - 20, 2026, for the ultimate Fabric, Power BI, AI and SQL community-led event. Save $200 with code FABCOMM.
Register now!- Power BI forums
- Get Help with Power BI
- Desktop
- Service
- Report Server
- Power Query
- Mobile Apps
- Developer
- DAX Commands and Tips
- Custom Visuals Development Discussion
- Health and Life Sciences
- Power BI Spanish forums
- Translated Spanish Desktop
- Training and Consulting
- Instructor Led Training
- Dashboard in a Day for Women, by Women
- Galleries
- Data Stories Gallery
- Themes Gallery
- Contests Gallery
- Quick Measures Gallery
- Notebook Gallery
- Translytical Task Flow Gallery
- TMDL Gallery
- R Script Showcase
- Webinars and Video Gallery
- Ideas
- Custom Visuals Ideas (read-only)
- Issues
- Issues
- Events
- Upcoming Events
To celebrate FabCon Vienna, we are offering 50% off select exams. Ends October 3rd. Request your discount now.
- Power BI forums
- Forums
- Get Help with Power BI
- Desktop
- Add a delta column in matrix
- Subscribe to RSS Feed
- Mark Topic as New
- Mark Topic as Read
- Float this Topic for Current User
- Bookmark
- Subscribe
- Printer Friendly Page
- Mark as New
- Bookmark
- Subscribe
- Mute
- Subscribe to RSS Feed
- Permalink
- Report Inappropriate Content
Add a delta column in matrix
I’m trying to reproduce an Excel report in Power BI but I’m struggling to do so.
I have a matrix visual with 6 measures displayed as rows and a date column that is filtered to only show the last 3 years as column.
I would like to add a delta column for each year to show how the measure changed from the previous year.
Is there a way to accomplish this? Even if it is with a different visual?
- Mark as New
- Bookmark
- Subscribe
- Mute
- Subscribe to RSS Feed
- Permalink
- Report Inappropriate Content
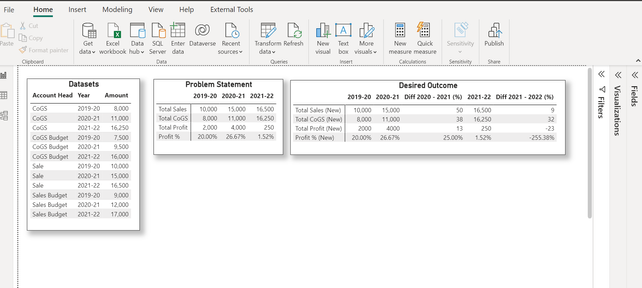
@brenda89111 I have created a sample dataset containing Account Head, Year and Amount as shown below. The solution is explained in the PBIX file, check the transformation steps in the Balance sheet (New) table. Hope this should give you an idea for fixing your problem.
The PBIX file has all the details.
If this post helps, then please consider to Accept it as the solution.
- Mark as New
- Bookmark
- Subscribe
- Mute
- Subscribe to RSS Feed
- Permalink
- Report Inappropriate Content
Hi @brenda89111 , It is easy you have to make use of date add function and create a new measure like below, but make sure oyu have datedimenison table and create a one to many relationship from date table to your table.
1. Previousyear= CALCULATE( [measure1], DATEADD('DimDate'[Date], -1, Year ))
2. diff % = divide([measure2]-[Previousyear],[Previousyear])
and you can do the same for other years too.
Regards,
Nikhil Chenna
Appreciate with a Kudos!! (Click the Thumbs Up Button)
Did I answer your question? Mark my post as a solution!
- Mark as New
- Bookmark
- Subscribe
- Mute
- Subscribe to RSS Feed
- Permalink
- Report Inappropriate Content
Hi,
Thank you for your reply. Unfortunately does the creation of a measure not solve my problem, as this would result in an extra row in my matrix instead of an extra column. I would also have to create seperate timelagged features for each of my 6 KPIs.
- Mark as New
- Bookmark
- Subscribe
- Mute
- Subscribe to RSS Feed
- Permalink
- Report Inappropriate Content
@brenda89111 , with help from date table and time intelligence you can get year behind measure to get diff
Year behind Sales = CALCULATE(SUM(Sales[Sales Amount]),dateadd('Date'[Date],-1,Year))
Year behind Sales = CALCULATE(SUM(Sales[Sales Amount]),SAMEPERIODLASTYEAR('Date'[Date]))
diff = [This Year]-[Year behind Sales]
diff % = divide([This Year]-[Year behind Sales],[Year behind Sales])
But that will display for all values.
You can check these Hybrid display blogs
if you are looking for a Hybrid display with Matrix Column and measure
https://community.powerbi.com/t5/Community-Blog/Creating-a-custom-or-hybrid-matrix-in-PowerBI/ba-p/1...
https://community.powerbi.com/t5/Quick-Measures-Gallery/The-New-Hotness-Custom-Matrix-Hierarchy/m-p/...
vote for Hybrid Table
https://ideas.powerbi.com/ideas/idea/?ideaid=9bc32b23-1eb1-4e74-8b34-349887b37ebc
Time Intelligence, DATESMTD, DATESQTD, DATESYTD, Week On Week, Week Till Date, Custom Period on Period,
Custom Period till date: https://youtu.be/aU2aKbnHuWs&t=145s
- Mark as New
- Bookmark
- Subscribe
- Mute
- Subscribe to RSS Feed
- Permalink
- Report Inappropriate Content
Thanks for pointing me to the threat about the hybrid display of a matrix. This comes very close to what I am looking for, instead that I don't have a column (e.g. products) on row, but sepperate measures. This makes things even more complicated. Perhabs I need to create the view I need in the database instead of trying to do this in Power BI desktop.
- Mark as New
- Bookmark
- Subscribe
- Mute
- Subscribe to RSS Feed
- Permalink
- Report Inappropriate Content
If you are still interested in looking to do this in Power BI, the custom/hybrid matrix method should still work with measures on rows. The only issue is you will need to code each measure to take the column layout into account.
Did I answer your question? Mark my post as a solution!
In doing so, you are also helping me. Thank you!
Proud to be a Super User!
Paul on Linkedin.


