Jumpstart your career with the Fabric Career Hub
Find everything you need to get certified on Fabric—skills challenges, live sessions, exam prep, role guidance, and more.
Get started- Power BI forums
- Updates
- News & Announcements
- Get Help with Power BI
- Desktop
- Service
- Report Server
- Power Query
- Mobile Apps
- Developer
- DAX Commands and Tips
- Custom Visuals Development Discussion
- Health and Life Sciences
- Power BI Spanish forums
- Translated Spanish Desktop
- Training and Consulting
- Instructor Led Training
- Dashboard in a Day for Women, by Women
- Galleries
- Community Connections & How-To Videos
- COVID-19 Data Stories Gallery
- Themes Gallery
- Data Stories Gallery
- R Script Showcase
- Webinars and Video Gallery
- Quick Measures Gallery
- 2021 MSBizAppsSummit Gallery
- 2020 MSBizAppsSummit Gallery
- 2019 MSBizAppsSummit Gallery
- Events
- Ideas
- Custom Visuals Ideas
- Issues
- Issues
- Events
- Upcoming Events
- Community Blog
- Power BI Community Blog
- Custom Visuals Community Blog
- Community Support
- Community Accounts & Registration
- Using the Community
- Community Feedback
Grow your Fabric skills and prepare for the DP-600 certification exam by completing the latest Microsoft Fabric challenge.
- Power BI forums
- Galleries
- Data Stories Gallery
- Re: Inventory Stock Analysis


- Mark as New
- Bookmark
- Subscribe
- Mute
- Subscribe to RSS Feed
- Permalink
- Report Inappropriate Content
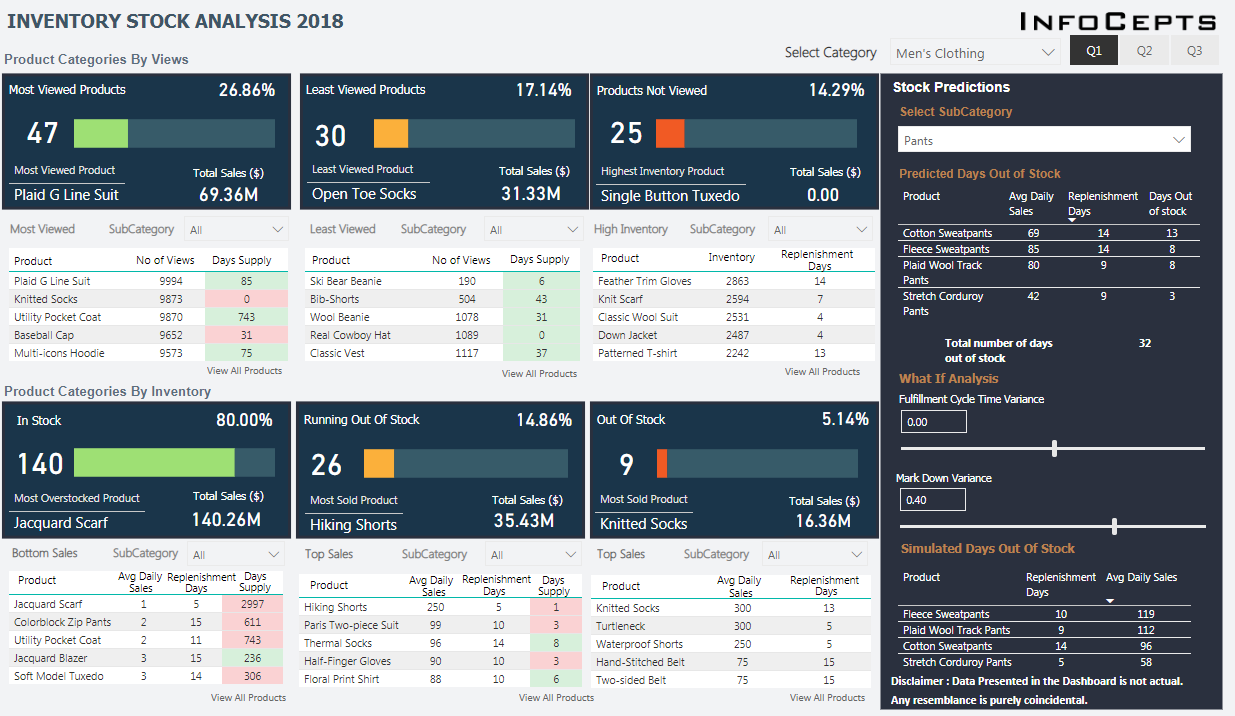
Inventory Stock Analysis
The dashboard represents an Analysis of Stock Inventory for the Year 2018. It’s broadly categorized into:
- Customer Views & Inventory.
- Category Selection – Men’s clothing & Women’s Clothing.
- Quarters 1, 2, and 3.
The Customer Views are further classified into Most Viewed, Least Viewed, and Unviewed Products. You can also view Percentage-based classification and Total Sales in USD. Finally, the top 5 products under each category are clearly outlined.
The dashboard also:
- Provides additional insights on Stock Inventory.
- Divides the top 5 products into individual categories segmented into Overall
Percentage and Total Sales.
Most importantly, you can predict ‘Availability of Stock’ and ‘Time to Replenish Stock’ based on factors like Fulfillment Cycle and MarkDown Variance.
eyJrIjoiYThkZTE4MWMtZWY4ZS00YmI3LWFiZGMtNGI1MzFhOGY1ZTFlIiwidCI6IjA0ZWM2MTA5LTRjNzktNGM3My1hZTcxLWE0NzRjMDlhMWY1YSJ9
- Mark as New
- Bookmark
- Subscribe
- Mute
- Subscribe to RSS Feed
- Permalink
- Report Inappropriate Content
Hey, Thank you for the feedback. It really meant a lot. We are unable to share the PBIX file due to internal copyright constraints. Hope you understand. However, I can help you with any specific queries, if any.
Happy to help. 🙂
- Mark as New
- Bookmark
- Subscribe
- Mute
- Subscribe to RSS Feed
- Permalink
- Report Inappropriate Content
Hi,
like to know how to create Aging report.
The report should contain Date Slicer (as date). from ther need to calculate the aging buckets.
Can you post samples here
- Mark as New
- Bookmark
- Subscribe
- Mute
- Subscribe to RSS Feed
- Permalink
- Report Inappropriate Content
Great work. Would love to know how this works from a structure POV. robert.j.tyler@live.co.uk if possible 🙂
- Mark as New
- Bookmark
- Subscribe
- Mute
- Subscribe to RSS Feed
- Permalink
- Report Inappropriate Content
Great work.
- Mark as New
- Bookmark
- Subscribe
- Mute
- Subscribe to RSS Feed
- Permalink
- Report Inappropriate Content
very intuitive
- Mark as New
- Bookmark
- Subscribe
- Mute
- Subscribe to RSS Feed
- Permalink
- Report Inappropriate Content
Neat! Good job !
- Mark as New
- Bookmark
- Subscribe
- Mute
- Subscribe to RSS Feed
- Permalink
- Report Inappropriate Content
Excellent work!!
- Mark as New
- Bookmark
- Subscribe
- Mute
- Subscribe to RSS Feed
- Permalink
- Report Inappropriate Content
Really well done! Any chance you'd be willing to share the PBIX file? ![]()
- Mark as New
- Bookmark
- Subscribe
- Mute
- Subscribe to RSS Feed
- Permalink
- Report Inappropriate Content
Great work. Very good