Jumpstart your career with the Fabric Career Hub
Find everything you need to get certified on Fabric—skills challenges, live sessions, exam prep, role guidance, and a 50 percent discount on exams.
Get started- Power BI forums
- Updates
- News & Announcements
- Get Help with Power BI
- Desktop
- Service
- Report Server
- Power Query
- Mobile Apps
- Developer
- DAX Commands and Tips
- Custom Visuals Development Discussion
- Health and Life Sciences
- Power BI Spanish forums
- Translated Spanish Desktop
- Power Platform Integration - Better Together!
- Power Platform Integrations (Read-only)
- Power Platform and Dynamics 365 Integrations (Read-only)
- Training and Consulting
- Instructor Led Training
- Dashboard in a Day for Women, by Women
- Galleries
- Community Connections & How-To Videos
- COVID-19 Data Stories Gallery
- Themes Gallery
- Data Stories Gallery
- R Script Showcase
- Webinars and Video Gallery
- Quick Measures Gallery
- 2021 MSBizAppsSummit Gallery
- 2020 MSBizAppsSummit Gallery
- 2019 MSBizAppsSummit Gallery
- Events
- Ideas
- Custom Visuals Ideas
- Issues
- Issues
- Events
- Upcoming Events
- Community Blog
- Power BI Community Blog
- Custom Visuals Community Blog
- Community Support
- Community Accounts & Registration
- Using the Community
- Community Feedback
Earn a 50% discount on the DP-600 certification exam by completing the Fabric 30 Days to Learn It challenge.
- Power BI forums
- Galleries
- Data Stories Gallery
- Re: Inventory Stock Analysis


- Mark as New
- Bookmark
- Subscribe
- Mute
- Subscribe to RSS Feed
- Permalink
- Report Inappropriate Content
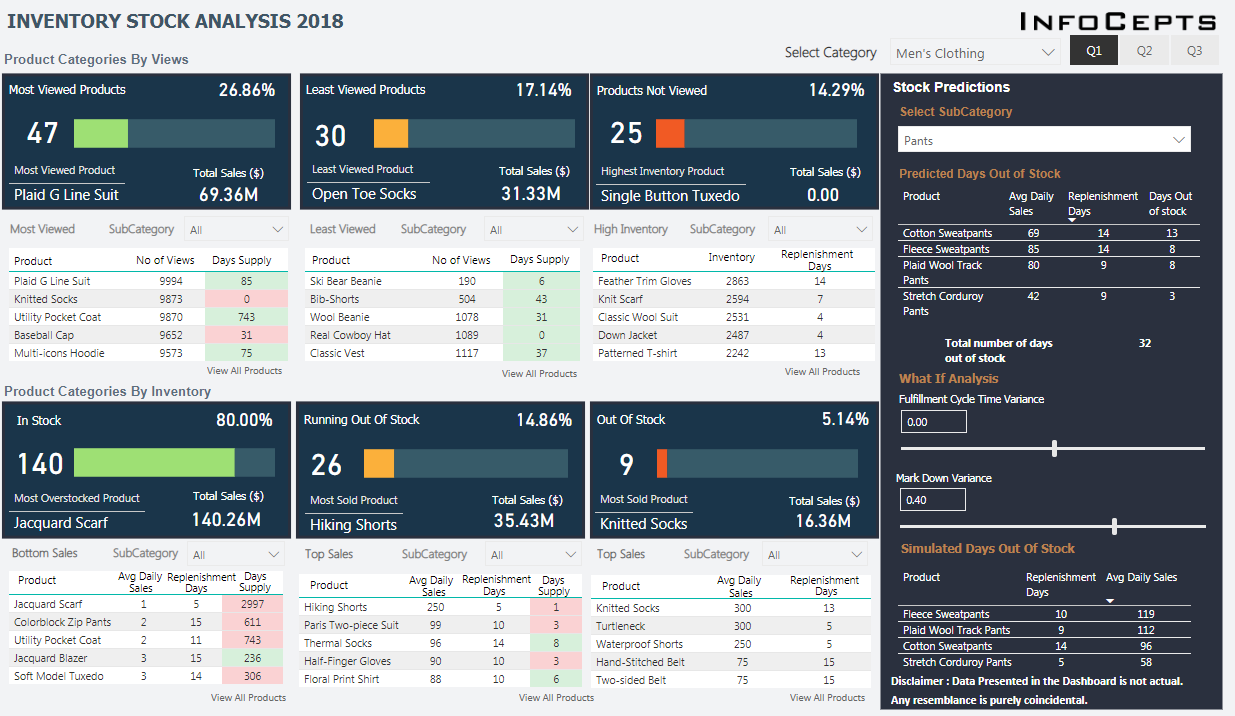
Inventory Stock Analysis
The dashboard represents an Analysis of Stock Inventory for the Year 2018. It’s broadly categorized into:
- Customer Views & Inventory.
- Category Selection – Men’s clothing & Women’s Clothing.
- Quarters 1, 2, and 3.
The Customer Views are further classified into Most Viewed, Least Viewed, and Unviewed Products. You can also view Percentage-based classification and Total Sales in USD. Finally, the top 5 products under each category are clearly outlined.
The dashboard also:
- Provides additional insights on Stock Inventory.
- Divides the top 5 products into individual categories segmented into Overall
Percentage and Total Sales.
Most importantly, you can predict ‘Availability of Stock’ and ‘Time to Replenish Stock’ based on factors like Fulfillment Cycle and MarkDown Variance.
eyJrIjoiYThkZTE4MWMtZWY4ZS00YmI3LWFiZGMtNGI1MzFhOGY1ZTFlIiwidCI6IjA0ZWM2MTA5LTRjNzktNGM3My1hZTcxLWE0NzRjMDlhMWY1YSJ9
- Mark as New
- Bookmark
- Subscribe
- Mute
- Subscribe to RSS Feed
- Permalink
- Report Inappropriate Content
Hi Rajesh, your dashboard looks very professional, good job. Could you share with me please what controls did you use to make the Q1 Q2 Q3 square-shaped selectors in the top right corner?
Thanks!
- Mark as New
- Bookmark
- Subscribe
- Mute
- Subscribe to RSS Feed
- Permalink
- Report Inappropriate Content
Pode enviar pra paulofrrz@yahoo.com.br
- Mark as New
- Bookmark
- Subscribe
- Mute
- Subscribe to RSS Feed
- Permalink
- Report Inappropriate Content
- Mark as New
- Bookmark
- Subscribe
- Mute
- Subscribe to RSS Feed
- Permalink
- Report Inappropriate Content
- Mark as New
- Bookmark
- Subscribe
- Mute
- Subscribe to RSS Feed
- Permalink
- Report Inappropriate Content
Could you share the .pbix file with me, please? yogo.wibowo@saptaindra.co.id
Thanks a lot!
- Mark as New
- Bookmark
- Subscribe
- Mute
- Subscribe to RSS Feed
- Permalink
- Report Inappropriate Content
Hi
I love your work, could you please share it with me? liga810@gmail.com
- Mark as New
- Bookmark
- Subscribe
- Mute
- Subscribe to RSS Feed
- Permalink
- Report Inappropriate Content
- Mark as New
- Bookmark
- Subscribe
- Mute
- Subscribe to RSS Feed
- Permalink
- Report Inappropriate Content
Increíble! Me compartirías el pbix por favor? sebarod1997@gmail.com
Gracias!
- Mark as New
- Bookmark
- Subscribe
- Mute
- Subscribe to RSS Feed
- Permalink
- Report Inappropriate Content
Hi, lovely dashboard, thanks for sharing. New to PowerBI, I'd be so grateful if you can share insight on how you created the single value sliders for your variance values on teh right hand side - I dont see single value sliders as default controls in Power BI?
Many thanks!
- Mark as New
- Bookmark
- Subscribe
- Mute
- Subscribe to RSS Feed
- Permalink
- Report Inappropriate Content

- Mark as New
- Bookmark
- Subscribe
- Mute
- Subscribe to RSS Feed
- Permalink
- Report Inappropriate Content
Hello,
Thank you 🙂
Yes, It is 100 % Stacked bar chart. Also, I have placed Card viz for displaying the metric value over the chart.
Thanks,
Rajesh
- Mark as New
- Bookmark
- Subscribe
- Mute
- Subscribe to RSS Feed
- Permalink
- Report Inappropriate Content
This is a 100% stacked bar chart
- Mark as New
- Bookmark
- Subscribe
- Mute
- Subscribe to RSS Feed
- Permalink
- Report Inappropriate Content
Awesome work. can you share the pbix file with me. mdaamir200@gmail.com
- Mark as New
- Bookmark
- Subscribe
- Mute
- Subscribe to RSS Feed
- Permalink
- Report Inappropriate Content
Thank you for your feedback. Sorry, we will not be able to share the PBIX as this is being our Organization's (InfoCepts Technology) IP. If you need any help with implementation please let us know and we would be happy to help.
Thanks,
Rajesh
- Mark as New
- Bookmark
- Subscribe
- Mute
- Subscribe to RSS Feed
- Permalink
- Report Inappropriate Content
Great insights,
Could you share to me PBIX please?
Many thanks mate
- Mark as New
- Bookmark
- Subscribe
- Mute
- Subscribe to RSS Feed
- Permalink
- Report Inappropriate Content
Hey, Thank you for the feedback. It really meant a lot. We are unable to share the PBIX file due to internal copyright constraints. Hope you understand. However, I can help you with any specific queries, if any. Happy to help.
- Mark as New
- Bookmark
- Subscribe
- Mute
- Subscribe to RSS Feed
- Permalink
- Report Inappropriate Content
Wont be able to share the PBIX as this is being our Organization's (InfoCepts Technology) IP. If you need any help with implementation please let us know and we would be happy to help.
@Anonymous @Anonymous @Anonymous
- Mark as New
- Bookmark
- Subscribe
- Mute
- Subscribe to RSS Feed
- Permalink
- Report Inappropriate Content
Hi,
would you be willing to share this Pbix file with me? My email is drmuralimca@gmail.com.
- Mark as New
- Bookmark
- Subscribe
- Mute
- Subscribe to RSS Feed
- Permalink
- Report Inappropriate Content
Hey, Thank you for the feedback. It really meant a lot. We are unable to share the PBIX file due to internal copyright constraints. Hope you understand. However, I can help you with any specific queries, if any.
Happy to help. 🙂
- Mark as New
- Bookmark
- Subscribe
- Mute
- Subscribe to RSS Feed
- Permalink
- Report Inappropriate Content
Hi,
like to know how to create Aging report.
The report should contain Date Slicer (as date). from ther need to calculate the aging buckets.
Can you post samples here
- Mark as New
- Bookmark
- Subscribe
- Mute
- Subscribe to RSS Feed
- Permalink
- Report Inappropriate Content
Great work. Would love to know how this works from a structure POV. robert.j.tyler@live.co.uk if possible 🙂