New Offer! Become a Certified Fabric Data Engineer
Check your eligibility for this 50% exam voucher offer and join us for free live learning sessions to get prepared for Exam DP-700.
Get Started- Power BI forums
- Get Help with Power BI
- Desktop
- Service
- Report Server
- Power Query
- Mobile Apps
- Developer
- DAX Commands and Tips
- Custom Visuals Development Discussion
- Health and Life Sciences
- Power BI Spanish forums
- Translated Spanish Desktop
- Training and Consulting
- Instructor Led Training
- Dashboard in a Day for Women, by Women
- Galleries
- Community Connections & How-To Videos
- COVID-19 Data Stories Gallery
- Themes Gallery
- Data Stories Gallery
- R Script Showcase
- Webinars and Video Gallery
- Quick Measures Gallery
- 2021 MSBizAppsSummit Gallery
- 2020 MSBizAppsSummit Gallery
- 2019 MSBizAppsSummit Gallery
- Events
- Ideas
- Custom Visuals Ideas
- Issues
- Issues
- Events
- Upcoming Events
Don't miss out! 2025 Microsoft Fabric Community Conference, March 31 - April 2, Las Vegas, Nevada. Use code MSCUST for a $150 discount. Prices go up February 11th. Register now.
- Power BI forums
- Galleries
- Data Stories Gallery
- Income Statement with Ratio Analysis
Income Statement with Ratio Analysis
09-14-2019 16:02 PM


- Mark as New
- Bookmark
- Subscribe
- Mute
- Subscribe to RSS Feed
- Permalink
- Report Inappropriate Content
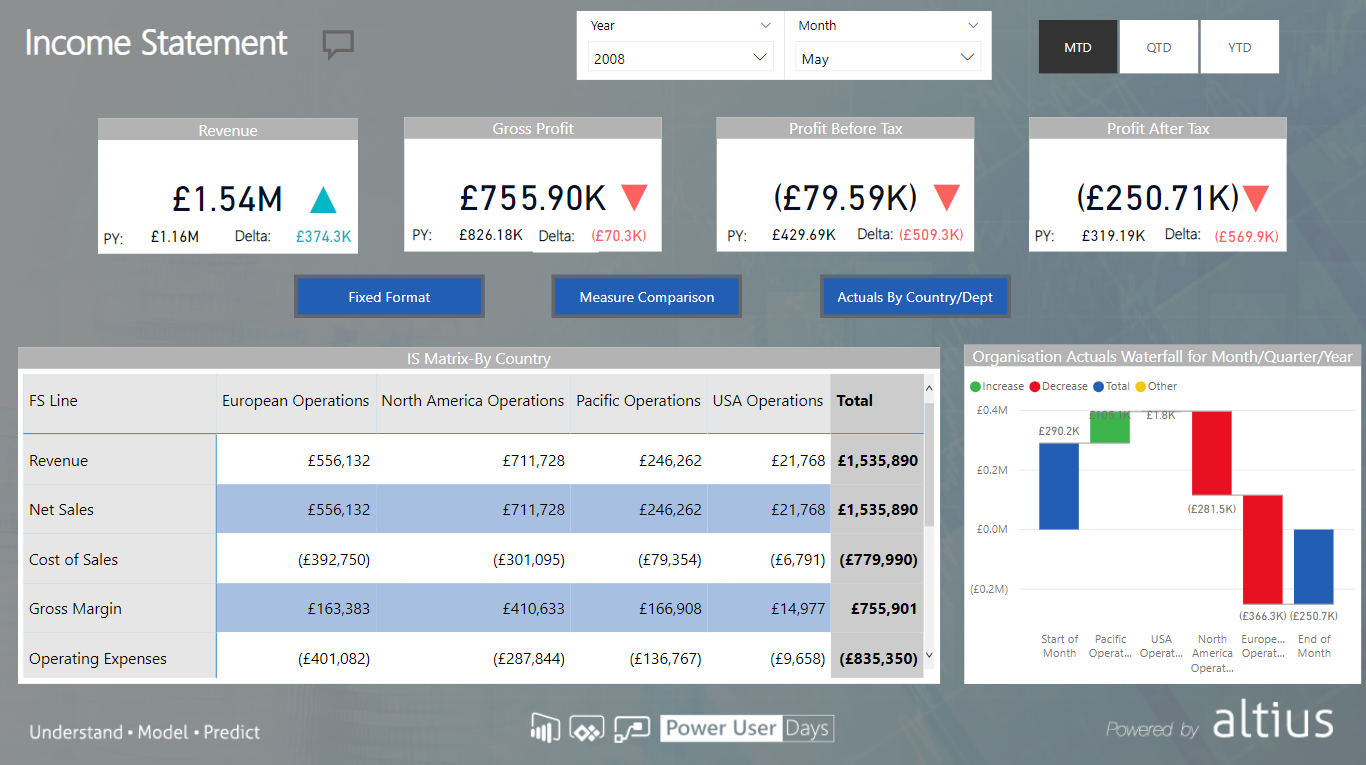
Income Statement with Ratio Analysis
This report shows a completed example of a flexible, dynamic and attention-focused Income Statement Report. It was built for and demonstrated at the innagrual Power User Days Finance event in London (July 2019) which brought together finance professionals who are interested in learning more about how the Power Platform can help with their role.
The report consists of 3 key report pages:
1) Income Statement: The key financial metrics are shown as cards at the top (along with up/down arrows and previous period values for context). Also included is an Income statement in a variety of formats (Fixed tabular format, Measure comparison with pivot-table style functionality and a breakdown by region across columns), and a waterfall chart which shows the contribution of each region to the change in value for the period selected. By Default this shows for Net Profit though if another line on the IS is selected the waterfall chart will reflect this line instead. The slicers at the top for year/month and MTD/QTD/YTD affect all the visuals on the page - the metrics, IS and waterfall chart can be viewed as monthly, quarter to date or year to date values for any selected month.
2) Ratio Analysis: This allows the user to focus on a particular financial ratio (e.g. Cost/Income Ratio, Gross Margin) and see how this ratio has changed since last year. The user can then drill into the drivers behind that change, looking at a breakdown of current vs prior year values by region, a country breakdown plotting the measure against revenue (for context of size), and a view of the ratio over time. The charts are chosen specifically to interact with eachother - e.g. selecting a region on the bullet chart (By OK Viz) updates the scatter chart to see a comparison between the countries within the region and to then see how the value has changed vs prior year by month on the line chart/see how the Income statement looks for that particular area of focus.
3) Planning: This utilises the Val Q Scenario Planning custom visual with a decomposition tree for a given metric/Income statement line and the ability to view it under different scenarios.
This report was highlighted as part of a presentation on Storytelling With Data which I presented at the Power Platform World Tour London in August 2019. To view a recording of this session see below/here
eyJrIjoiZTVkNjlkMDItYTk5Yy00M2RiLWJmMjYtM2Y4ZWViNDA0NDYyIiwidCI6IjBjNzk5ZDM4LTQ3NjQtNDJiYy1iNGZmLTIzYmViYTljN2ZlMiIsImMiOjh9
- Mark as New
- Bookmark
- Subscribe
- Mute
- Subscribe to RSS Feed
- Permalink
- Report Inappropriate Content
Hello,
It's an amazing dashboard which is quite insightful.
Can you let me know if this dataset is open to use for study purposes and can be shared on the portfolio?
Thanks
Thanks
- Mark as New
- Bookmark
- Subscribe
- Mute
- Subscribe to RSS Feed
- Permalink
- Report Inappropriate Content
Hi yes its available from the first module of the course (which is free to access) on www.powerplatformfinance.com!
- Mark as New
- Bookmark
- Subscribe
- Mute
- Subscribe to RSS Feed
- Permalink
- Report Inappropriate Content
Hi - do you mind providing some information on how you were able to show the waterfall with month start and month end? I'm trying to achieve similar results, but when I filter to a specific month it'll only show one single bar as a reference point. Thanks.
- Mark as New
- Bookmark
- Subscribe
- Mute
- Subscribe to RSS Feed
- Permalink
- Report Inappropriate Content
- Mark as New
- Bookmark
- Subscribe
- Mute
- Subscribe to RSS Feed
- Permalink
- Report Inappropriate Content
These dashboards are elegant. And the presentation at Power User Days was very informative. Thank you!
David (Portland, Oregon)