- Power BI forums
- Updates
- News & Announcements
- Get Help with Power BI
- Desktop
- Service
- Report Server
- Power Query
- Mobile Apps
- Developer
- DAX Commands and Tips
- Custom Visuals Development Discussion
- Health and Life Sciences
- Power BI Spanish forums
- Translated Spanish Desktop
- Power Platform Integration - Better Together!
- Power Platform Integrations (Read-only)
- Power Platform and Dynamics 365 Integrations (Read-only)
- Training and Consulting
- Instructor Led Training
- Dashboard in a Day for Women, by Women
- Galleries
- Community Connections & How-To Videos
- COVID-19 Data Stories Gallery
- Themes Gallery
- Data Stories Gallery
- R Script Showcase
- Webinars and Video Gallery
- Quick Measures Gallery
- 2021 MSBizAppsSummit Gallery
- 2020 MSBizAppsSummit Gallery
- 2019 MSBizAppsSummit Gallery
- Events
- Ideas
- Custom Visuals Ideas
- Issues
- Issues
- Events
- Upcoming Events
- Community Blog
- Power BI Community Blog
- Custom Visuals Community Blog
- Community Support
- Community Accounts & Registration
- Using the Community
- Community Feedback
Earn a 50% discount on the DP-600 certification exam by completing the Fabric 30 Days to Learn It challenge.
- Power BI forums
- Galleries
- Data Stories Gallery
- Re: Icon Map custom visual examples


- Mark as New
- Bookmark
- Subscribe
- Mute
- Subscribe to RSS Feed
- Permalink
- Report Inappropriate Content
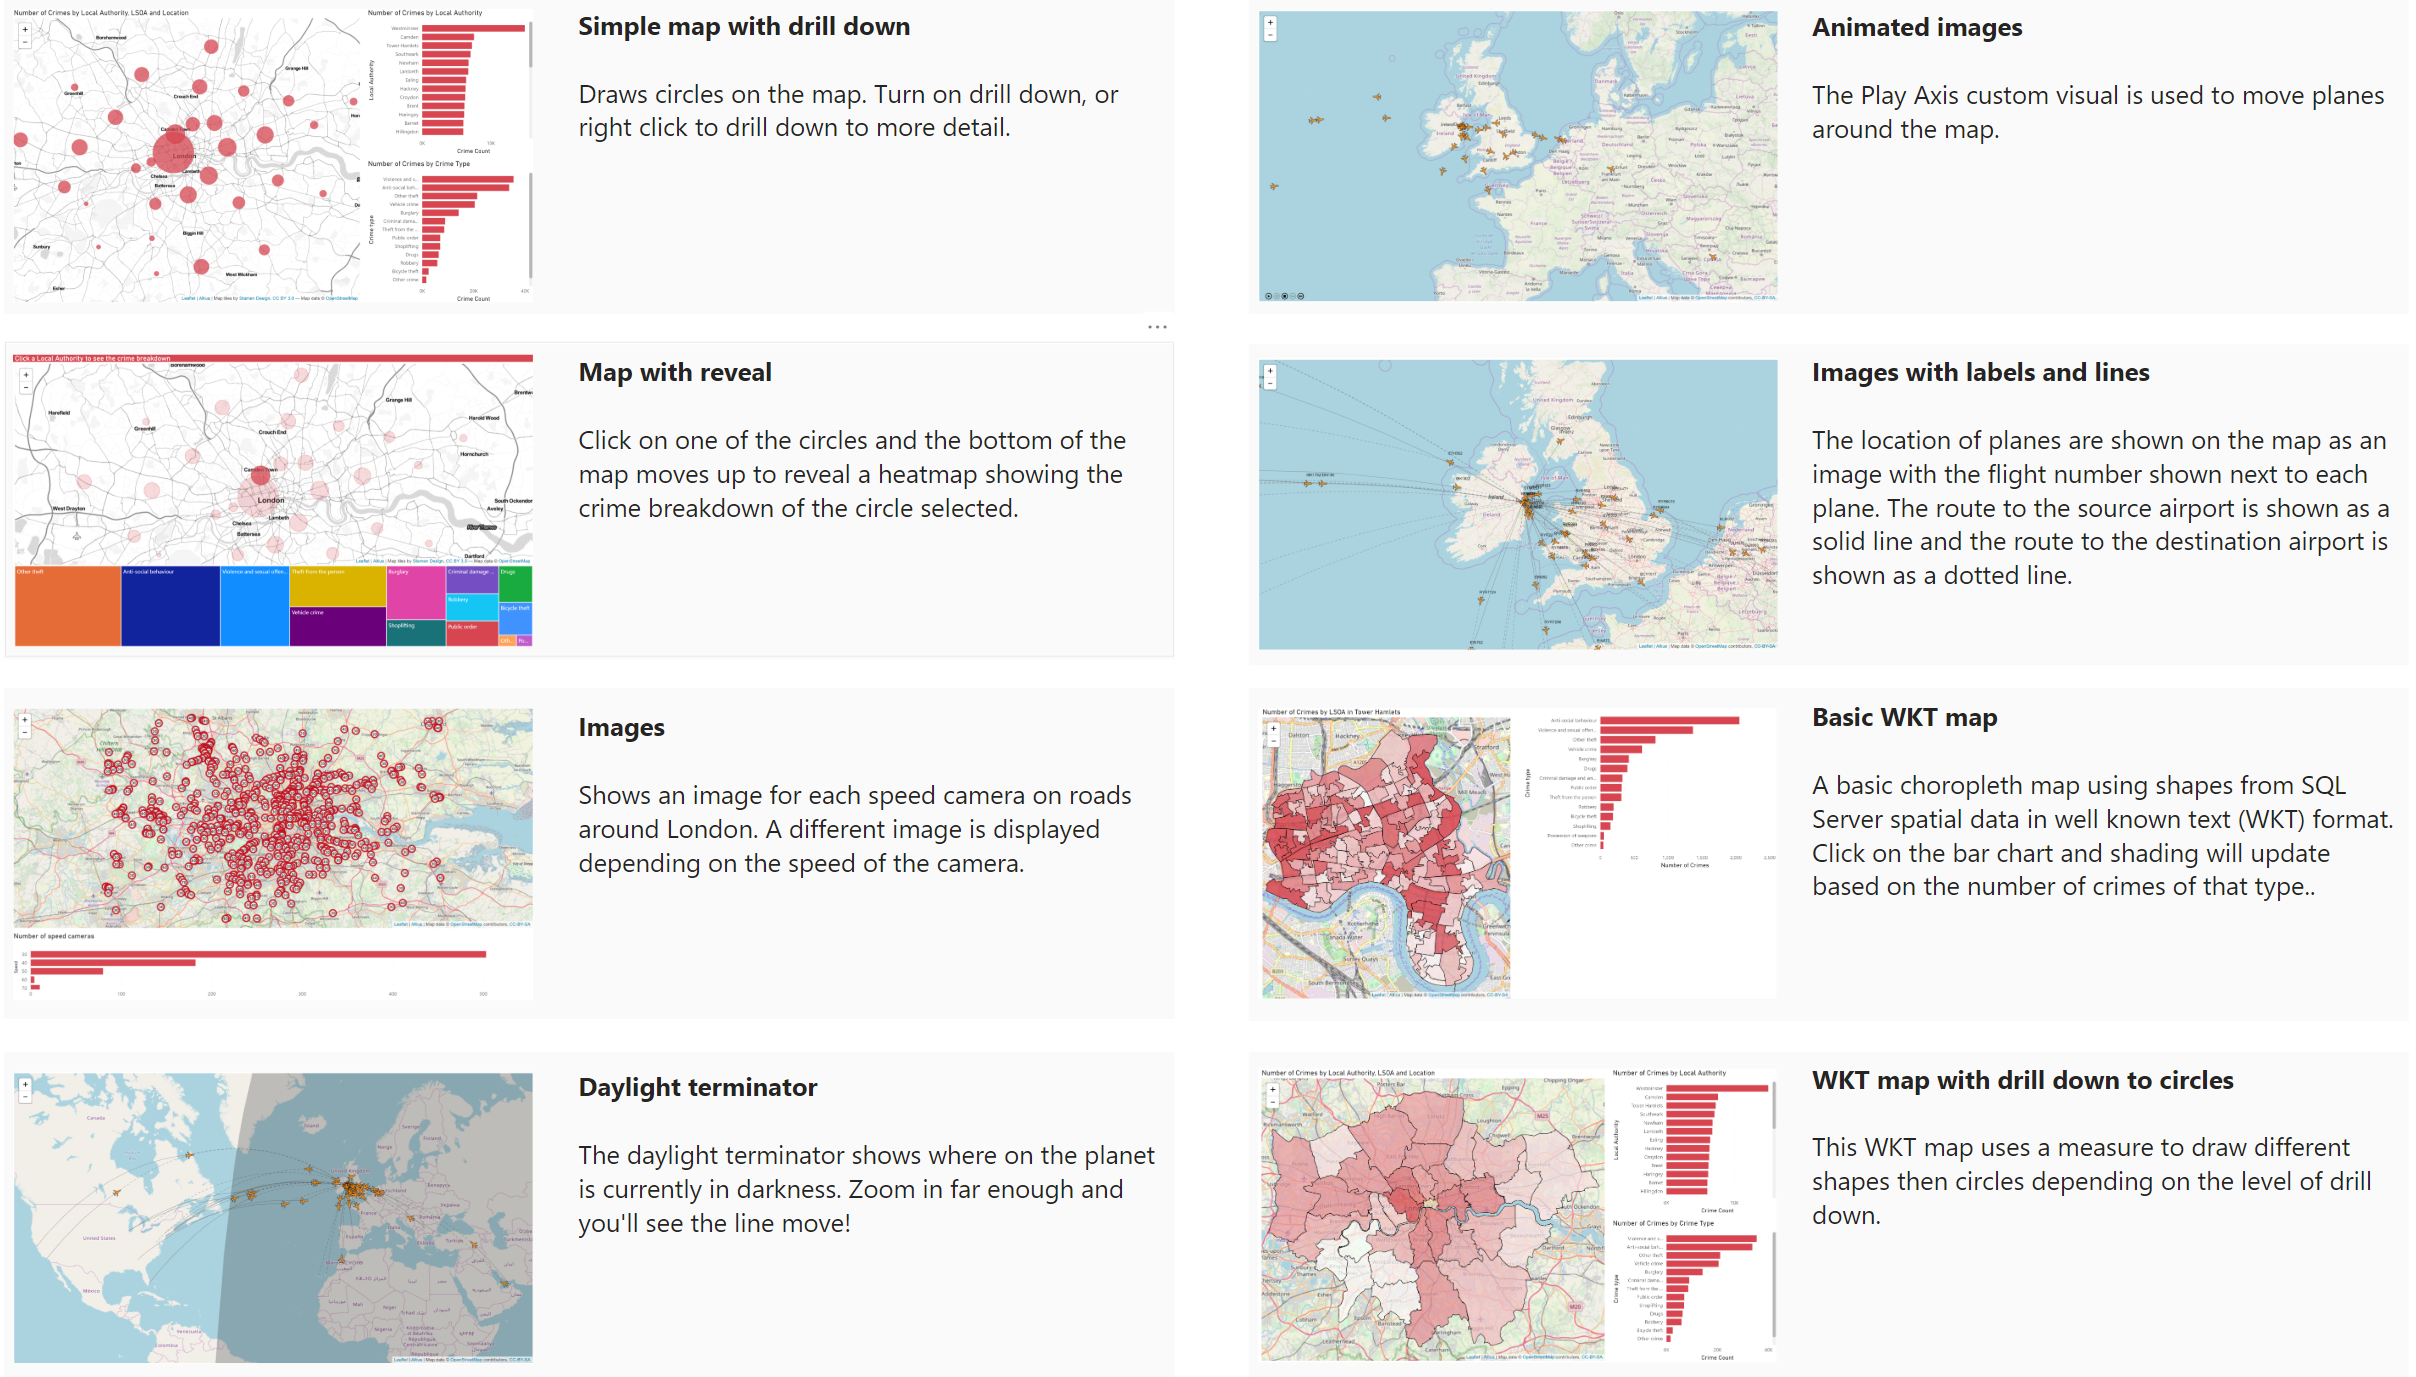
Icon Map custom visual examples
This report contains a number of example maps that can be created using the Icon Map custom visual.
These examples have been built using the latest version of Icon Map being released in September 2019 in the Custom Visuals Marketplace.
eyJrIjoiNjJkN2E0MmYtMGJhZi00NDhjLThkZGQtNjE1YmE4YWYxMTU1IiwidCI6IjBjNzk5ZDM4LTQ3NjQtNDJiYy1iNGZmLTIzYmViYTljN2ZlMiIsImMiOjh9
- Mark as New
- Bookmark
- Subscribe
- Mute
- Subscribe to RSS Feed
- Permalink
- Report Inappropriate Content
Hi @OpenDataLab
If you get a copy of the style URL from Mapbox Studio it should look something along the lines of:
mapbox://styles/[Account Name]/[Style ID]
To get this to work in Icon Map translate the Account Name and Style ID to the following format, and add in your Mapbox access token at the end.
https://api.mapbox.com/styles/v1/[Account Name]/[Style ID]/tiles/256/{z}/{x}/{y}?access_token=[Access Token]
That should do the trick.
James
- Mark as New
- Bookmark
- Subscribe
- Mute
- Subscribe to RSS Feed
- Permalink
- Report Inappropriate Content
Hi;
Great Job looks fantastic. Will it support layering of points on top of polygons?
Kindest Regards
Simon Richardson
- Mark as New
- Bookmark
- Subscribe
- Mute
- Subscribe to RSS Feed
- Permalink
- Report Inappropriate Content

- Mark as New
- Bookmark
- Subscribe
- Mute
- Subscribe to RSS Feed
- Permalink
- Report Inappropriate Content
Hi @jamesdales ,
I want to draw similar kind of polygon on to the map. I have scenario where I want to draw the boundaries within city to identify which area is looked after by which office. I have two questions:
1) Is it possible to draw those boundaries/polygon on the map and the same map can be used in power BI to show the filter affects such as choose an area which is looked after by particular office using drop down list of office?
2) If yes, then could you please point out to some literature of doing that stuff in power BI?
Thanks in advance. I have been looking for the solution of this problem for a long time.
- Mark as New
- Bookmark
- Subscribe
- Mute
- Subscribe to RSS Feed
- Permalink
- Report Inappropriate Content
Looks awesome - cant wait! Any chance you can sling me the .pbiviz for an early look?
Choropleth with drill down and mixing point layers will be my main interest. If I interpreted your previous post correctly, SQL is not a requirement, just a column of text data in their WKT format? Will that be limited in length?
Will/does it support Mapbox tilesets for choropleth layers?