FabCon is coming to Atlanta
Join us at FabCon Atlanta from March 16 - 20, 2026, for the ultimate Fabric, Power BI, AI and SQL community-led event. Save $200 with code FABCOMM.
Register now!- Power BI forums
- Get Help with Power BI
- Desktop
- Service
- Report Server
- Power Query
- Mobile Apps
- Developer
- DAX Commands and Tips
- Custom Visuals Development Discussion
- Health and Life Sciences
- Power BI Spanish forums
- Translated Spanish Desktop
- Training and Consulting
- Instructor Led Training
- Dashboard in a Day for Women, by Women
- Galleries
- Data Stories Gallery
- Themes Gallery
- Contests Gallery
- QuickViz Gallery
- Quick Measures Gallery
- Visual Calculations Gallery
- Notebook Gallery
- Translytical Task Flow Gallery
- TMDL Gallery
- R Script Showcase
- Webinars and Video Gallery
- Ideas
- Custom Visuals Ideas (read-only)
- Issues
- Issues
- Events
- Upcoming Events
View all the Fabric Data Days sessions on demand. View schedule
- Data Factory forums
- Forums
- Get Help with Data Factory
- Pipelines
- Re: Unable to open Pipeline: Failed to load resour...
- Subscribe to RSS Feed
- Mark Topic as New
- Mark Topic as Read
- Float this Topic for Current User
- Bookmark
- Subscribe
- Printer Friendly Page
- Mark as New
- Bookmark
- Subscribe
- Mute
- Subscribe to RSS Feed
- Permalink
- Report Inappropriate Content
Unable to open Pipeline: Failed to load resource - Request is blocked by upstream service
Hello,
I am having issues with Pipelines that started this morning:
Note: nothing else is currently running on the monitoring hub.
My only scheduled pipeline failed this morning; when trying to see the details of the "run (through "Recent Runs" or through the "Monitoring Hub", I get "Your request was rejected due to resource constratraints. Try again later"
Also, I am unable to open (edit) any pipelines; when the editor tries to open, I get a "Failed to load resource xxxxxx-xxxx-xxxx-xxxx-xxxxxxx; request failed with 429(Too many requests): Request is blocked by upstream service" notification.
Here is the related Activity Id:
- Mark as New
- Bookmark
- Subscribe
- Mute
- Subscribe to RSS Feed
- Permalink
- Report Inappropriate Content
Is there any solution for this?
I’m currently facing the same issue. Last Thursday, our capacity was throttled - we had utilized around 130%. To address it, we created another F64 and swapped the capacity in the workspace.
Now that I’ve switched back to the original capacity, I’m getting the following error when trying to open the pipeline. Could you please help?
- Mark as New
- Bookmark
- Subscribe
- Mute
- Subscribe to RSS Feed
- Permalink
- Report Inappropriate Content
Hi @JFTxJ
Thanks for raising the support ticket. Sorry for the inconvenience, I observe that some of the users are also facing the similar issue.
I have escalated this to our internal team and will definitely come back to you if I get an update. Please continue using Fabric Community for help regarding your queries.
Appreciate your patience.
- Mark as New
- Bookmark
- Subscribe
- Mute
- Subscribe to RSS Feed
- Permalink
- Report Inappropriate Content
I am also receiving this error - would love an update if anyone here finds a solution.
- Mark as New
- Bookmark
- Subscribe
- Mute
- Subscribe to RSS Feed
- Permalink
- Report Inappropriate Content
This is due to your workspace capacity running into throttling. It should recover automatically, if the capacity is not stressed any further. Adding @mihirwagleMSFT who is the product owner for the Fabric capacities.
- Mark as New
- Bookmark
- Subscribe
- Mute
- Subscribe to RSS Feed
- Permalink
- Report Inappropriate Content
Hi @ajarora ,
Thank you for your input. I agree with you that I am running into throttling (from the error message). However, this is the first time that this issue happens after many weeks of using our fabric capacity, and the behavior started on a holiday (Thanksgiving in Canada) and no-one was working on Fabric at the time.
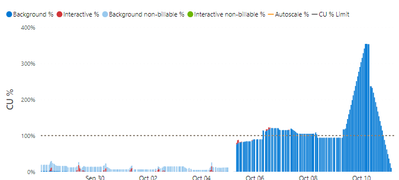
However, using the Fabric Capacity Metric report, I can clearly see that we were overutilizing our capacity:

|
However, even now that the capacity has gone back down below our 100% levels, we are still experiencing the same issue (unable to open notebooks, pipelines, and all dataflows are still failing).
I have open a support ticket (case 2310100040008022) and I am getting feedback from support that there is something wrong with accessing the Blob storage in the backend and that would be the underlying cause of the issue. I will be confirming configuration of the Azure Datalake storage with them today and I will update here if there is any progress.
- Mark as New
- Bookmark
- Subscribe
- Mute
- Subscribe to RSS Feed
- Permalink
- Report Inappropriate Content
Hi @JFTxJ
Apologies for the delay in the response.
Just wanted to check whether your issue got resolved. Continue using Fabric Community for help regarding your queries.
Thanks
- Mark as New
- Bookmark
- Subscribe
- Mute
- Subscribe to RSS Feed
- Permalink
- Report Inappropriate Content
@dirkdunn when did this behavior start for you?
From my logs, it looks like my issues started on Oct 6th
- Mark as New
- Bookmark
- Subscribe
- Mute
- Subscribe to RSS Feed
- Permalink
- Report Inappropriate Content
Yes, I am receiving this error as well, I hope you get an answer soon!
Helpful resources
| User | Count |
|---|---|
| 7 | |
| 3 | |
| 3 | |
| 2 | |
| 2 |


