FabCon is coming to Atlanta
Join us at FabCon Atlanta from March 16 - 20, 2026, for the ultimate Fabric, Power BI, AI and SQL community-led event. Save $200 with code FABCOMM.
Register now!- Power BI forums
- Get Help with Power BI
- Desktop
- Service
- Report Server
- Power Query
- Mobile Apps
- Developer
- DAX Commands and Tips
- Custom Visuals Development Discussion
- Health and Life Sciences
- Power BI Spanish forums
- Translated Spanish Desktop
- Training and Consulting
- Instructor Led Training
- Dashboard in a Day for Women, by Women
- Galleries
- Data Stories Gallery
- Themes Gallery
- Contests Gallery
- QuickViz Gallery
- Quick Measures Gallery
- Visual Calculations Gallery
- Notebook Gallery
- Translytical Task Flow Gallery
- TMDL Gallery
- R Script Showcase
- Webinars and Video Gallery
- Ideas
- Custom Visuals Ideas (read-only)
- Issues
- Issues
- Events
- Upcoming Events
View all the Fabric Data Days sessions on demand. View schedule
- Power BI forums
- Forums
- Get Help with Power BI
- DAX Commands and Tips
- looping through past dates
- Subscribe to RSS Feed
- Mark Topic as New
- Mark Topic as Read
- Float this Topic for Current User
- Bookmark
- Subscribe
- Printer Friendly Page
- Mark as New
- Bookmark
- Subscribe
- Mute
- Subscribe to RSS Feed
- Permalink
- Report Inappropriate Content
looping through past dates
Hellou guys,
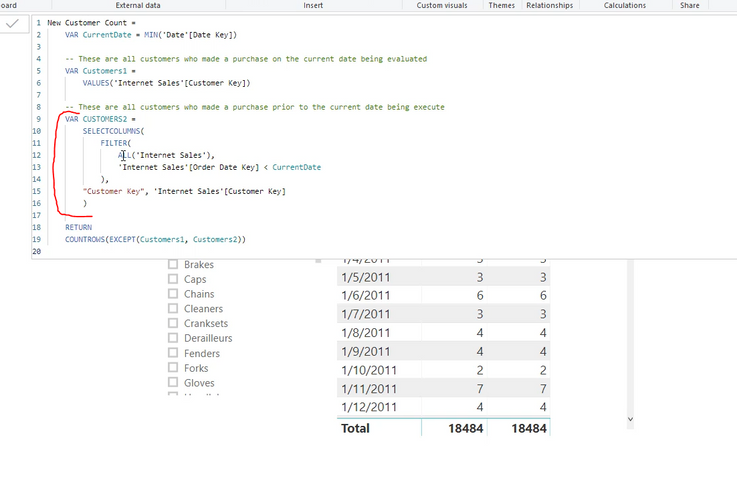
I have problem with example below. I am in some DAX course with exercizes , but even with this result I cant get red highlighted part.
Task was, identify and count new customers in specific day(means, they had purchase first time that date).
Cant get red highlighted part. According my backround from excel I suppose that there is loop via customer key- then inside that is comparing (another loop, but via dates) if ANY of their purchases was before current date of visual(in this case for example first line-1/5/2011..
So their are two loops basicaly..Is that correct thinking, pls?And if so, what exactly is triggering those loops?
SOLUTION:
- Mark as New
- Bookmark
- Subscribe
- Mute
- Subscribe to RSS Feed
- Permalink
- Report Inappropriate Content
Hi @Delopiero84
you should manipulate the Date filter context instead.
New customer count =
VAR CurrentDate =
    MIN ( 'Date'[Date Key] )
VAR CurrentCustomers =
    VALUES ( 'Internet Sales'[Customer Key] )
VAR OldCustomers =
    CALCULATETABLE (
        VALUES ( 'Internet Sales'[Customer Key] ),
        REMOVEFILTERS ( 'Date' ),
        'Date'[Date Key] <= CurrentDate
    )
RETURN
COUNTROWS ( EXCEPT ( CurrentCustomers, OldCustomers ) )- Mark as New
- Bookmark
- Subscribe
- Mute
- Subscribe to RSS Feed
- Permalink
- Report Inappropriate Content
Hi:
I can try to explain. Your table or matrix looks like it is on a daily basis. So that sets the filter context. Because you are analyzing by date, in this case MIN or MAX or AVG all are the same thing.
SELECTCOLUMNS is an iterator, so it will go row by row and you are basically renaming a column(s). Here you are renaming InternetSales[Customer Key] to "Customer Key". But before doing this (FILTER FIRST-EVALUATE SECOND) you are Filltering all the order dates(which have customer keys) in the internet sales table for the time period before any date you examine on your date visual.. (Since your currentdate variable is the same as the date you are looking at in your table.) So on Jan 7th you are looking at any date before Jan 7th to see if any customer key comes up to satisfy your variable named Customers2. This is producing a list of every customer who bought before Jan7th.
Your first variable Customers1 is all the customers buying on jan7th.
So your result is figuring any customer who bought on jan7th(Customer1) that had not bought before this date. This makes them new.
I hope this makes some sense. If your table was monthly, Cusomers1 would be any customer buying in this month and Customers2 would be any customers buying before this month.
Helpful resources

Power BI Monthly Update - November 2025
Check out the November 2025 Power BI update to learn about new features.

Fabric Data Days
Advance your Data & AI career with 50 days of live learning, contests, hands-on challenges, study groups & certifications and more!

| User | Count |
|---|---|
| 13 | |
| 11 | |
| 9 | |
| 5 | |
| 4 |
| User | Count |
|---|---|
| 28 | |
| 20 | |
| 19 | |
| 18 | |
| 12 |

