FabCon is coming to Atlanta
Join us at FabCon Atlanta from March 16 - 20, 2026, for the ultimate Fabric, Power BI, AI and SQL community-led event. Save $200 with code FABCOMM.
Register now!- Power BI forums
- Get Help with Power BI
- Desktop
- Service
- Report Server
- Power Query
- Mobile Apps
- Developer
- DAX Commands and Tips
- Custom Visuals Development Discussion
- Health and Life Sciences
- Power BI Spanish forums
- Translated Spanish Desktop
- Training and Consulting
- Instructor Led Training
- Dashboard in a Day for Women, by Women
- Galleries
- Data Stories Gallery
- Themes Gallery
- Contests Gallery
- QuickViz Gallery
- Quick Measures Gallery
- Visual Calculations Gallery
- Notebook Gallery
- Translytical Task Flow Gallery
- TMDL Gallery
- R Script Showcase
- Webinars and Video Gallery
- Ideas
- Custom Visuals Ideas (read-only)
- Issues
- Issues
- Events
- Upcoming Events
The Power BI Data Visualization World Championships is back! Get ahead of the game and start preparing now! Learn more
- Power BI forums
- Forums
- Get Help with Power BI
- DAX Commands and Tips
- Thousand Seperator using DAX formula with Conditio...
- Subscribe to RSS Feed
- Mark Topic as New
- Mark Topic as Read
- Float this Topic for Current User
- Bookmark
- Subscribe
- Printer Friendly Page
- Mark as New
- Bookmark
- Subscribe
- Mute
- Subscribe to RSS Feed
- Permalink
- Report Inappropriate Content
Thousand Seperator using DAX formula with Conditional formatting
Hi Team,
I need to create dashboard showcasing the measure with monthly numbers, but facing few challenge
1. How to show Thousand Separator for $ amount
2. How to color-code based on Comparing Target value, some Measure has to be lower and some have a Bigger target
| Measure Name | Target | Jan-20 | Feb-20 | Mar-20 | Apr-20 |
| Dollar Saved | $8,000 | $28,732 | $30,900 | $33,483 | $43,893 |
| % Customer Satisfaction | >85 | 89 | 90 | 87 | 95 |
| # of New Employees | <1000 | 89898 | 5000 | 250 | 500 |
| Saved Hrs on deployment | >3hrs | 7hrs | 8hrs | 4hrs | 8hrs |
- Mark as New
- Bookmark
- Subscribe
- Mute
- Subscribe to RSS Feed
- Permalink
- Report Inappropriate Content
Hi @Anonymous
The thousand separator is standard functionality and can be found at:
If the "normal" conditional formating is not sufficient, you can you the option "Format by Field value", this allows you to assign colors for any custom calculation:
Jan
if this is a solution for you, don't forget to mark it as such. thanks
- Mark as New
- Bookmark
- Subscribe
- Mute
- Subscribe to RSS Feed
- Permalink
- Report Inappropriate Content
Hi JustJan,
Standard Thousand seperator functionality not work as mine columns contains different format like %age, $, # and hrs value. So is there any other way ?
Some Measure created by using formula
"$"& Text.From (Number.Round ([#"Field Name"],2))
Or
Text.From (Number.Round([#"Incidents"]*100,2)) & "%"
For color coding you have suggested the static while I'm trying to find a dynamic so If Target changed the color coding changed and also looking to code based on % range
Green: equal or below the target and with a less than 5% Variance above target. Amber: Above 5% variance of the target. Red: Above 10% variance of the target
OR
Green: equal or above the target and with a less than 5% Variance above target. Amber: Above 5% variance of the target. Red: Above 10% variance of the target
- Mark as New
- Bookmark
- Subscribe
- Mute
- Subscribe to RSS Feed
- Permalink
- Report Inappropriate Content
hI @Anonymous
It seems that you calculate your "measure" in m-query.
When you use" Number.ToText(12345,67,"N") you will get a text "12,345.67"
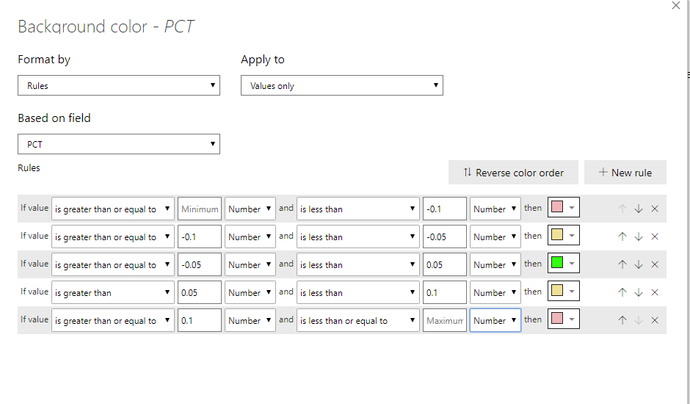
The code I suggested is merely an example, you can put any measure / expression that leads to True() (in this case), but if I understand you threshold correctly, than you can use the standard conditional formating by rule, use your calculated percentage in the rules.
There is also an option to use percent in the rule, but that does not allow for negative values.
So your percentage calculation now drives the colors in the conditional format
Jan
Helpful resources

Power BI Monthly Update - November 2025
Check out the November 2025 Power BI update to learn about new features.

Fabric Data Days
Advance your Data & AI career with 50 days of live learning, contests, hands-on challenges, study groups & certifications and more!

| User | Count |
|---|---|
| 19 | |
| 10 | |
| 9 | |
| 4 | |
| 4 |
| User | Count |
|---|---|
| 31 | |
| 31 | |
| 20 | |
| 12 | |
| 12 |


