FabCon is coming to Atlanta
Join us at FabCon Atlanta from March 16 - 20, 2026, for the ultimate Fabric, Power BI, AI and SQL community-led event. Save $200 with code FABCOMM.
Register now!- Power BI forums
- Get Help with Power BI
- Desktop
- Service
- Report Server
- Power Query
- Mobile Apps
- Developer
- DAX Commands and Tips
- Custom Visuals Development Discussion
- Health and Life Sciences
- Power BI Spanish forums
- Translated Spanish Desktop
- Training and Consulting
- Instructor Led Training
- Dashboard in a Day for Women, by Women
- Galleries
- Data Stories Gallery
- Themes Gallery
- Contests Gallery
- QuickViz Gallery
- Quick Measures Gallery
- Visual Calculations Gallery
- Notebook Gallery
- Translytical Task Flow Gallery
- TMDL Gallery
- R Script Showcase
- Webinars and Video Gallery
- Ideas
- Custom Visuals Ideas (read-only)
- Issues
- Issues
- Events
- Upcoming Events
The Power BI Data Visualization World Championships is back! Get ahead of the game and start preparing now! Learn more
- Power BI forums
- Forums
- Get Help with Power BI
- DAX Commands and Tips
- Sort order breaks running total measure!!
- Subscribe to RSS Feed
- Mark Topic as New
- Mark Topic as Read
- Float this Topic for Current User
- Bookmark
- Subscribe
- Printer Friendly Page
- Mark as New
- Bookmark
- Subscribe
- Mute
- Subscribe to RSS Feed
- Permalink
- Report Inappropriate Content
Sort order breaks running total measure!!
I have a simple sales table below: 'Sales'
This thrown into a simple Matrix looks like this:
My objective is to move the TOTALs to the front of the matrix (left) and then to create a measure that results in a running total week over week of the Goal amounts. To do this I created a new table ( 'Week Order' ) to sum all data across all date points. See picture below:
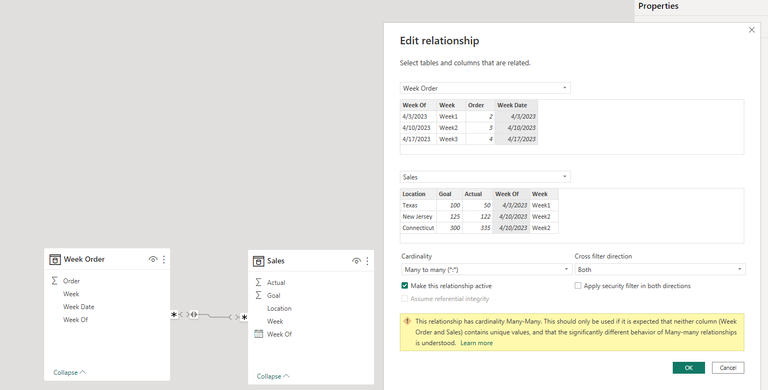
I then related the two tables on 'Sales'[Week] and 'Week Order'[Week Date]
This allows me to use 'Week Order'[Week Of] as the column object in my matrix.
Now I need to create a measure to calculate the running total of the Goal amounts.
Goal Running Total = CALCULATE(
    sum(Sales[Goal]),
    FILTER(
        all('Week Order'[Week Of]),
        'Week Order'[Week Of] <= MAX('Week Order'[Week Of])
    )
)
When I throw this measure into the matrix everything works fine before sorting [Week Of]. You can see below that the running total for goals adds each week. 4/10/23 = 250, 4/17/23 = 100 + 250, 4/3/2023 = 125+ 100 + 250
Now, when I sort [Week Of] by [Order] the measure no longer compiles the Goal total each week.
This is the problem I need help solving.
- Mark as New
- Bookmark
- Subscribe
- Mute
- Subscribe to RSS Feed
- Permalink
- Report Inappropriate Content
Try this version
Goal Running Total =
var mx = MAX('Week Order'[Week Of])
return CALCULATE( sum(Sales[Goal]),'Week Order'[Week Of] <= mx)
Helpful resources

Power BI Dataviz World Championships
The Power BI Data Visualization World Championships is back! Get ahead of the game and start preparing now!

Power BI Monthly Update - November 2025
Check out the November 2025 Power BI update to learn about new features.

| User | Count |
|---|---|
| 20 | |
| 10 | |
| 9 | |
| 4 | |
| 4 |
| User | Count |
|---|---|
| 32 | |
| 31 | |
| 18 | |
| 12 | |
| 11 |


