FabCon is coming to Atlanta
Join us at FabCon Atlanta from March 16 - 20, 2026, for the ultimate Fabric, Power BI, AI and SQL community-led event. Save $200 with code FABCOMM.
Register now!- Power BI forums
- Get Help with Power BI
- Desktop
- Service
- Report Server
- Power Query
- Mobile Apps
- Developer
- DAX Commands and Tips
- Custom Visuals Development Discussion
- Health and Life Sciences
- Power BI Spanish forums
- Translated Spanish Desktop
- Training and Consulting
- Instructor Led Training
- Dashboard in a Day for Women, by Women
- Galleries
- Data Stories Gallery
- Themes Gallery
- Contests Gallery
- QuickViz Gallery
- Quick Measures Gallery
- Visual Calculations Gallery
- Notebook Gallery
- Translytical Task Flow Gallery
- TMDL Gallery
- R Script Showcase
- Webinars and Video Gallery
- Ideas
- Custom Visuals Ideas (read-only)
- Issues
- Issues
- Events
- Upcoming Events
The Power BI Data Visualization World Championships is back! Get ahead of the game and start preparing now! Learn more
- Power BI forums
- Forums
- Get Help with Power BI
- DAX Commands and Tips
- Sort graph axis values (DAX generated)
- Subscribe to RSS Feed
- Mark Topic as New
- Mark Topic as Read
- Float this Topic for Current User
- Bookmark
- Subscribe
- Printer Friendly Page
- Mark as New
- Bookmark
- Subscribe
- Mute
- Subscribe to RSS Feed
- Permalink
- Report Inappropriate Content
Sort graph axis values (DAX generated)
Hello community,
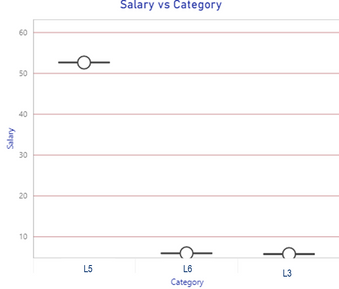
I have created a Boxplot chart showing salary distribution per category. The categories are retrieved from a table that was created by DAX. As you can see in the photo, the categories order is random and I want to sort the categories so I have L3, L5, L6.
How can I do that?
Thanks in advance 🙂
Solved! Go to Solution.
- Mark as New
- Bookmark
- Subscribe
- Mute
- Subscribe to RSS Feed
- Permalink
- Report Inappropriate Content
@Anonymous , Create a sort column mark that as sort column and sort visual on axis
How to Create Sort Column and Solve Related Errors:
https://www.youtube.com/watch?v=KK1zu4MBb-c
https://docs.microsoft.com/en-us/power-bi/desktop-sort-by-column
- Mark as New
- Bookmark
- Subscribe
- Mute
- Subscribe to RSS Feed
- Permalink
- Report Inappropriate Content
Thank you for your feedback @amitchandak
what I did to resolve this problem , is that i Created the ID column in the DAX code that I used to generate my table. By so doing, I have no dependency between category and ID_cat so. COnsequently, when I used sort column by ID_Cat it worked successfully.
Conclusion: try to avoid circular dependency
- Mark as New
- Bookmark
- Subscribe
- Mute
- Subscribe to RSS Feed
- Permalink
- Report Inappropriate Content
@Anonymous , Create a sort column mark that as sort column and sort visual on axis
How to Create Sort Column and Solve Related Errors:
https://www.youtube.com/watch?v=KK1zu4MBb-c
https://docs.microsoft.com/en-us/power-bi/desktop-sort-by-column
Helpful resources

Power BI Dataviz World Championships
The Power BI Data Visualization World Championships is back! Get ahead of the game and start preparing now!

| User | Count |
|---|---|
| 7 | |
| 5 | |
| 4 | |
| 3 | |
| 3 |
| User | Count |
|---|---|
| 19 | |
| 10 | |
| 8 | |
| 7 | |
| 7 |


