FabCon is coming to Atlanta
Join us at FabCon Atlanta from March 16 - 20, 2026, for the ultimate Fabric, Power BI, AI and SQL community-led event. Save $200 with code FABCOMM.
Register now!- Power BI forums
- Get Help with Power BI
- Desktop
- Service
- Report Server
- Power Query
- Mobile Apps
- Developer
- DAX Commands and Tips
- Custom Visuals Development Discussion
- Health and Life Sciences
- Power BI Spanish forums
- Translated Spanish Desktop
- Training and Consulting
- Instructor Led Training
- Dashboard in a Day for Women, by Women
- Galleries
- Data Stories Gallery
- Themes Gallery
- Contests Gallery
- Quick Measures Gallery
- Notebook Gallery
- Translytical Task Flow Gallery
- TMDL Gallery
- R Script Showcase
- Webinars and Video Gallery
- Ideas
- Custom Visuals Ideas (read-only)
- Issues
- Issues
- Events
- Upcoming Events
To celebrate FabCon Vienna, we are offering 50% off select exams. Ends October 3rd. Request your discount now.
- Power BI forums
- Forums
- Get Help with Power BI
- DAX Commands and Tips
- Schedule, Gantt
- Subscribe to RSS Feed
- Mark Topic as New
- Mark Topic as Read
- Float this Topic for Current User
- Bookmark
- Subscribe
- Printer Friendly Page
- Mark as New
- Bookmark
- Subscribe
- Mute
- Subscribe to RSS Feed
- Permalink
- Report Inappropriate Content
Schedule, Gantt
Hi,
I need some Help, I use Excel to create a schedule, like a Gantt Chart, Imagen:
I use this formula to calculate de cells :
=SE(MÍNIMO($AB$1-SOMA(AD$8:AD19),$Z20-SOMA($AB20:AC20))=0,"",MÍNIMO($AB$1-SOMA(AD$8:AD19),$Z20-SOMA($AB20:AC20)))
SE = IF
Mínimo = Min
Soma = Sum
I need to do the same schedule on power BI.
I dont have StarDate and EndDate.
it´s need to calculate a daily production of 15000 units, from the current day, when the 15000 closes, needs to switch to the next day with the balance of the previous day and count another 15000.
- Mark as New
- Bookmark
- Subscribe
- Mute
- Subscribe to RSS Feed
- Permalink
- Report Inappropriate Content
If it helps, in excel this looks like:
=IF($H37=J$34,$F37,IF(AND($H37=J$34+1,$G37>0),$G37,""))
- Mark as New
- Bookmark
- Subscribe
- Mute
- Subscribe to RSS Feed
- Permalink
- Report Inappropriate Content
Hi Lucas, I think I understand now.
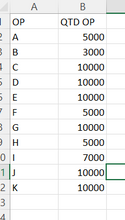
I am recreating with two sets of data, one is for OP & QTD and the other is just a list of dates:
In DAX, we are unable to self-reference an expression. This means that you cannot refer back to a previous row within the same expression.
However, it is possible to arithmetically calculate the amounts that should be allocated to each OP & day, using combinations of cumulative and modulus functions.
Measures created
CONST = 14700
Cumulative = sumX(
    WINDOW(
        1,ABS,0,REL,
        ORDERBY(gant[OP], ASC)
    ),
    [Sum of Quantity]
)
Mod = mod([Cumulative],[CONST])
Quotient = QUOTIENT([Cumulative],[CONST])
quantity less mod = if([Sum of Quantity]  -[Mod]>0,[Sum of Quantity]  -[Mod])
Date that completes qty = Date(2023,06,03)  +[Quotient]
I had to create a measure for the "constant" 14700
this is what it looks like laid out in a table:
We can then use the date that completes qty to calculate when o put the straight Qty amount in, and if it is the day before, use the Quantity less mod:
Production day = switch( TRUE(),
     [Date that completes qty] = SELECTEDVALUE(DATES[DATE]),[Sum of Quantity],
     [Date that completes qty] - 1 = SELECTEDVALUE(DATES[DATE]),[quantity less mod])
This results in a pivot table as such:
How does this work?
The cumulative amount is the total units that need to be produced in order of OP. We then take the quotient, to see how many times 14700 fits into it - this is the number of days until this would be complete. We can then use this to calculate dates and match to the dates in the column headings and fill with either the quantity or a remainder.
There are other ways to do this, but this is simplest for now, assuming that the CONST might not be a constant or linked to some other value.
HTH,
Pi
- Mark as New
- Bookmark
- Subscribe
- Mute
- Subscribe to RSS Feed
- Permalink
- Report Inappropriate Content
Hi Lucas,
I think we're going to need more information. While the excel formula is helpful, I can't see the column references for the cells.
Can you tell me
- What does the raw data look like? (or provide)
- What is the calculation achieving & why, very broadly.
While the detail calculation itself is useful (min / max sum etc) there is a much wider range of expressions in DAX and the resulting steps may be different and more optimal than just trying to replicate every part of an excel expression.
PS Intendo portugues 🙂
Pi
- Mark as New
- Bookmark
- Subscribe
- Mute
- Subscribe to RSS Feed
- Permalink
- Report Inappropriate Content
I´m sorry, I rewrote the text, I thing it´s clearer now.
I showing the expression that I use on Excel, because it was the way that a found to resolve.
Helpful resources
| User | Count |
|---|---|
| 15 | |
| 9 | |
| 8 | |
| 6 | |
| 5 |
| User | Count |
|---|---|
| 31 | |
| 19 | |
| 15 | |
| 7 | |
| 6 |


