Party with Power BI’s own Guy in a Cube
Power BI is turning 10! Tune in for a special live episode on July 24 with behind-the-scenes stories, product evolution highlights, and a sneak peek at what’s in store for the future.
Save the date- Power BI forums
- Get Help with Power BI
- Desktop
- Service
- Report Server
- Power Query
- Mobile Apps
- Developer
- DAX Commands and Tips
- Custom Visuals Development Discussion
- Health and Life Sciences
- Power BI Spanish forums
- Translated Spanish Desktop
- Training and Consulting
- Instructor Led Training
- Dashboard in a Day for Women, by Women
- Galleries
- Data Stories Gallery
- Themes Gallery
- Contests Gallery
- Quick Measures Gallery
- Notebook Gallery
- Translytical Task Flow Gallery
- TMDL Gallery
- R Script Showcase
- Webinars and Video Gallery
- Ideas
- Custom Visuals Ideas (read-only)
- Issues
- Issues
- Events
- Upcoming Events
Enhance your career with this limited time 50% discount on Fabric and Power BI exams. Ends August 31st. Request your voucher.
- Power BI forums
- Forums
- Get Help with Power BI
- DAX Commands and Tips
- RE : How to average value with group by and summar...
- Subscribe to RSS Feed
- Mark Topic as New
- Mark Topic as Read
- Float this Topic for Current User
- Bookmark
- Subscribe
- Printer Friendly Page
- Mark as New
- Bookmark
- Subscribe
- Mute
- Subscribe to RSS Feed
- Permalink
- Report Inappropriate Content
RE : How to average value with group by and summarized
Hi all ,
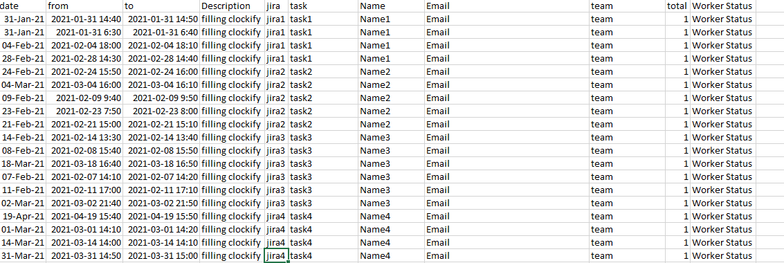
i am trying to write a dax function to calculate the total time recorded by the worker , by grouping the jira id and name . here is the dataset . The column total has the time recorded by the worker . can anyone please help out with this ? Thanks in advance.
Solved! Go to Solution.
- Mark as New
- Bookmark
- Subscribe
- Mute
- Subscribe to RSS Feed
- Permalink
- Report Inappropriate Content
@yash_atluri
Or a simple average measure should work. The table visual will automatically group by the included columns like Name and Jira, although they are the same in this sample.
Paul Zheng _ Community Support Team
If this post helps, please Accept it as the solution to help the other members find it more quickly.
- Mark as New
- Bookmark
- Subscribe
- Mute
- Subscribe to RSS Feed
- Permalink
- Report Inappropriate Content
I didn't use any DAX. Just added the fields to a table visual and changed the aggregation on Total to be average
- Mark as New
- Bookmark
- Subscribe
- Mute
- Subscribe to RSS Feed
- Permalink
- Report Inappropriate Content
I'm confused. I put the 2 fields in a table, selected average for the Total field and it gets the required result.
What am I missing?
(also why is the Total field a rowcount - so that makes it different from the original posted picture where it's all 1 and it's not total time either - which is 10 minutes on each row)?
- Mark as New
- Bookmark
- Subscribe
- Mute
- Subscribe to RSS Feed
- Permalink
- Report Inappropriate Content
can you send me the dax you used ? i just want to try on original data ?
- Mark as New
- Bookmark
- Subscribe
- Mute
- Subscribe to RSS Feed
- Permalink
- Report Inappropriate Content
Yes, I saw the column but it was 1 all the way. It didn't look right.
If you repost the data (not a picture) and show me what the desired output is, I'll have a go
- Mark as New
- Bookmark
- Subscribe
- Mute
- Subscribe to RSS Feed
- Permalink
- Report Inappropriate Content
https://mega.nz/file/yVoFRATQ#v5gyEoPYpxJGnDhbePONL19R8iWOxjbc1VCdLYJgoyw
hi here is the xlsx file which has the data and the pivot table has desired values i need , i hope it helps ?
- Mark as New
- Bookmark
- Subscribe
- Mute
- Subscribe to RSS Feed
- Permalink
- Report Inappropriate Content
The first thing to do is to get the time worked in each row (a time_worked column). I would probably do this in Power Query but you can use DATEDIFF (and from , to have to be datetime type) if you want to do it in DAX.
You should be able to create a visual with id and name, and sum the new Time_worked column.
If you want a separate calculated table, you can use SUMMARIZECOLUMNS
- Mark as New
- Bookmark
- Subscribe
- Mute
- Subscribe to RSS Feed
- Permalink
- Report Inappropriate Content
The total is the column where it has time worked in the each row , when i am creating a visual , the total time worked by worker is showing correctly , but when i am selecting average instead of sum , it averages the total based on time entry , but here total time entries needs to by grouped by jira and average of that is needed
Helpful resources
| User | Count |
|---|---|
| 22 | |
| 11 | |
| 8 | |
| 6 | |
| 6 |
| User | Count |
|---|---|
| 25 | |
| 12 | |
| 11 | |
| 7 | |
| 6 |


