FabCon is coming to Atlanta
Join us at FabCon Atlanta from March 16 - 20, 2026, for the ultimate Fabric, Power BI, AI and SQL community-led event. Save $200 with code FABCOMM.
Register now!- Power BI forums
- Get Help with Power BI
- Desktop
- Service
- Report Server
- Power Query
- Mobile Apps
- Developer
- DAX Commands and Tips
- Custom Visuals Development Discussion
- Health and Life Sciences
- Power BI Spanish forums
- Translated Spanish Desktop
- Training and Consulting
- Instructor Led Training
- Dashboard in a Day for Women, by Women
- Galleries
- Data Stories Gallery
- Themes Gallery
- Contests Gallery
- QuickViz Gallery
- Quick Measures Gallery
- Visual Calculations Gallery
- Notebook Gallery
- Translytical Task Flow Gallery
- TMDL Gallery
- R Script Showcase
- Webinars and Video Gallery
- Ideas
- Custom Visuals Ideas (read-only)
- Issues
- Issues
- Events
- Upcoming Events
The Power BI Data Visualization World Championships is back! Get ahead of the game and start preparing now! Learn more
- Power BI forums
- Forums
- Get Help with Power BI
- DAX Commands and Tips
- Percentile of a table stored in a variable
- Subscribe to RSS Feed
- Mark Topic as New
- Mark Topic as Read
- Float this Topic for Current User
- Bookmark
- Subscribe
- Printer Friendly Page
- Mark as New
- Bookmark
- Subscribe
- Mute
- Subscribe to RSS Feed
- Permalink
- Report Inappropriate Content
Percentile of a table stored in a variable
Hi all,
I would like to detect outliers in my daily data report by using the percentile function.
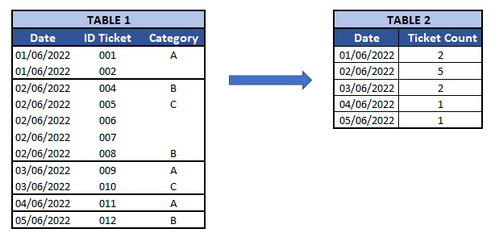
I have a detail table (table 1) and I want to calculate the percentile of the second table which shows the tickets per day.
If I create a fixed calculated table I have to add "ALL / AllExcept" function inside Percentile function:
Percentile = PERCENTILEX.EXC (ALL(TicketsByDate), TicketsByDate[Count_Tickets], .90 )
I need to apply external filters and I don't want to rely on the All/AllExcept function.
For this reason, I want to store my calculated table in a variable. The problem is that I can't calculate the percentile of this calculated table in a variable.
I get the following error: "If k is not a multiple of 1/(n + 1), PERCENTILEX.EXC will interpolate to determine the value at the k-th percentile."
Can someone help me? Thanks!!!
Solved! Go to Solution.
- Mark as New
- Bookmark
- Subscribe
- Mute
- Subscribe to RSS Feed
- Permalink
- Report Inappropriate Content
Hello,
I've found the solution to my problem. In the first parameter of the percentile function you need to include a calculated table and use the SelectedAll function.
This is the metric that calculates the outliers:
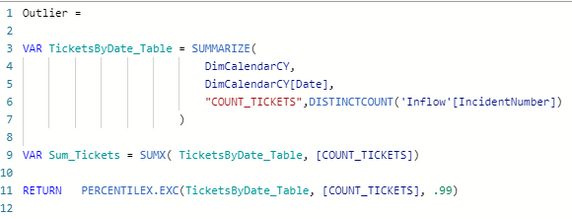
Outlier =

VAR Percentile =  CALCULATE(PERCENTILEX.INC (
            SUMMARIZE (
                ALLSELECTED(Tickets),
                Tickets[Date],
                "Count", DISTINCTCOUNT(Tickets[TicketId])
            ),
            [Count],
            0.95
        ), ALLSELECTED())

RETURN CALCULATE( 'Calculations'[CountTickets_Measure],
                    FILTER(
                        SUMMARIZE (
                                Tickets ,
                                Tickets[Date],
                                "Count", DISTINCTCOUNT(Tickets[TicketId])
                            ),
                        [Count]>Percentile
                    )
                )
And this is the complementary metric that calculates the green values in the column chart:
StandardValues = IF( 'Calculations'[CountTickets_Measure] = 'Calculations'[OutlierTable], BLANK(), 'Calculations'[CountTickets_Measure])Thank you for your help!
I hope someone will find it useful 🙂
- Mark as New
- Bookmark
- Subscribe
- Mute
- Subscribe to RSS Feed
- Permalink
- Report Inappropriate Content
By the way, I've also tried the percentile function with a measure but it doesn't work either. I get the same error.
If anyone can think of another solution... I need help 😕
Thanks!!
- Mark as New
- Bookmark
- Subscribe
- Mute
- Subscribe to RSS Feed
- Permalink
- Report Inappropriate Content
Hi, @Anonymous
You can try the following methods.
Table 2 =
SUMMARIZE (
    'Table 1',
    'Table 1'[Date],
    "Count Ticket", COUNT ( 'Table 1'[ID Ticket] )
)
Measure = CALCULATE(PERCENTILEX.EXC('Table 2',[Count Ticket],0.8),ALL('Table 2'))In your case, k can be 0.2, 0.4, 0.6, 0.8.
Best Regards,
Community Support Team _Charlotte
If this post helps, then please consider Accept it as the solution to help the other members find it more quickly.
- Mark as New
- Bookmark
- Subscribe
- Mute
- Subscribe to RSS Feed
- Permalink
- Report Inappropriate Content
Hi @v-zhangti !
First of all, thank you for your help.
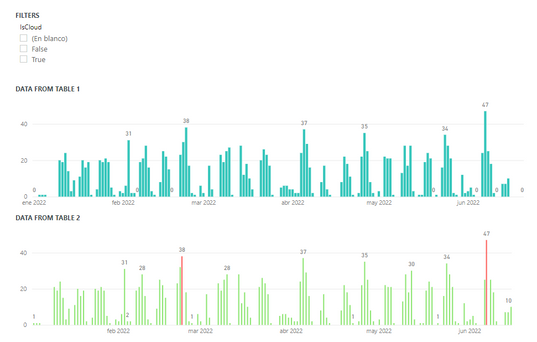
The solution you propose allows me to calculate the percentile on the tickets total count. In this picture you can see that the data in both tables match (table 2 calculated as you told me).
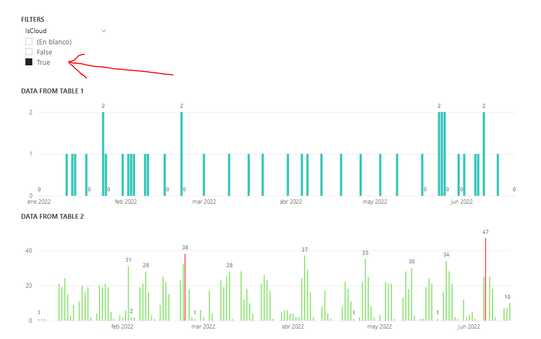
The problem is that filters in table 2 don't work. In this image you can see that the filter "IsCloud" applies only for data in table 1.
To solve that problem I guess I would have to add the dimensions I want to filter by to my table 2. There are too many dimensions I want to filter by, so I would like to avoid creating table 2 as fixed (its cardinality would be too large).
So, my idea is a temporary table stored in a variable where the filters apply correctly. I have tested this solution to get the total count (sum) of the tickets and it works --> The sum of tickets in table 1 and the sum of the table stored in a variable return the same value (with filters it also matches)
My problem is that it doesn't work for percentiles (I get the error: "If k is not a multiple of 1/(n + 1), PERCENTILEX.EXC will interpolate to determine the value at the k-th percentile.").
Please, if you have any idea how to do these calculations and make the filters work, I would appreciate it.
Thanks!!
- Mark as New
- Bookmark
- Subscribe
- Mute
- Subscribe to RSS Feed
- Permalink
- Report Inappropriate Content
Hi, @Anonymous
Can you provide simple pbix files? There is so little information available that it is unclear what data the IsCloud slicer is filtering. What kind of output do you expect when you select True for IsCloud? What kind of output do you expect when you select False?
Best Regards
- Mark as New
- Bookmark
- Subscribe
- Mute
- Subscribe to RSS Feed
- Permalink
- Report Inappropriate Content
Hi, @v-zhangti
First of all, thank you for your help.
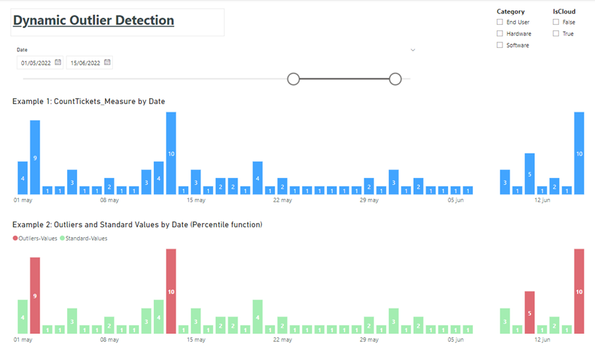
My goal is to visualise in a column chart those days whose number of tickets represents an outlier (example 2).
Example 1 shows a column chart with the number of tickets per day. It uses a measure that performs a CountDistinct of the TicketId.
Example 2 shows a column chart where red represents outliers and green represents normal values. It uses two complementary metrics. The important metric "Outliers-Values" uses the percentile function. Days whose ticket counts are above the percentile are considered outliers (red).
My problem is I can't visualise correctly the data of example 2 when I apply filters.
Looking at the following image with the slicer “IsCloud=False”, I would like to see in example 2 the same values as the column chart in example 1 and represent in red the column with 9 tickets.
I attach a pbix with a simple dataset. The "Tickets" table presents the detail of the tickets I want to analyse and is connected to its dimension tables.
The table "Tickets_By_Date" is a summarize per date of the number of tickets in the "Tickets" table.
I hope I’ve been able to explain better my goal and the problem I have.
Any help is welcome and appreciated!
Thanks to all of you!!
Helpful resources

Power BI Monthly Update - November 2025
Check out the November 2025 Power BI update to learn about new features.

Fabric Data Days
Advance your Data & AI career with 50 days of live learning, contests, hands-on challenges, study groups & certifications and more!

| User | Count |
|---|---|
| 20 | |
| 11 | |
| 9 | |
| 4 | |
| 4 |
| User | Count |
|---|---|
| 31 | |
| 29 | |
| 21 | |
| 12 | |
| 12 |
