Fabric Data Days starts November 4th!
Advance your Data & AI career with 50 days of live learning, dataviz contests, hands-on challenges, study groups & certifications and more!
Get registered- Power BI forums
- Get Help with Power BI
- Desktop
- Service
- Report Server
- Power Query
- Mobile Apps
- Developer
- DAX Commands and Tips
- Custom Visuals Development Discussion
- Health and Life Sciences
- Power BI Spanish forums
- Translated Spanish Desktop
- Training and Consulting
- Instructor Led Training
- Dashboard in a Day for Women, by Women
- Galleries
- Data Stories Gallery
- Themes Gallery
- Contests Gallery
- QuickViz Gallery
- Quick Measures Gallery
- Visual Calculations Gallery
- Notebook Gallery
- Translytical Task Flow Gallery
- TMDL Gallery
- R Script Showcase
- Webinars and Video Gallery
- Ideas
- Custom Visuals Ideas (read-only)
- Issues
- Issues
- Events
- Upcoming Events
Get Fabric Certified for FREE during Fabric Data Days. Don't miss your chance! Request now
- Power BI forums
- Forums
- Get Help with Power BI
- DAX Commands and Tips
- Multiply Sum with Average
- Subscribe to RSS Feed
- Mark Topic as New
- Mark Topic as Read
- Float this Topic for Current User
- Bookmark
- Subscribe
- Printer Friendly Page
- Mark as New
- Bookmark
- Subscribe
- Mute
- Subscribe to RSS Feed
- Permalink
- Report Inappropriate Content
Multiply Sum with Average
Hello. I am trying to figure out how to get this to work in Power BI. The rows on my table represent tickets with a number value (hours of work.) This table is joined with a separate table that contains some additional information about the tickets from a different database, including the hours available for each team. I'm trying to sum up the hours of work associated with each ticket and divide by the time each team has available. I'm able to represent the sum of hours of work and the average hours available in a table, but riding the struggle bus trying to use them in additional calculations.
The underlying data would look something like this:
I think the next step is to get the data summarized by team which would ideally look something like this: (this is where I'm stuck)
And the end goal would be to sum up the average hours available by team (and sum of hours of work) to get a final utilization percentage.
Any help would be appreciated. I can't seem to find the right solution thus far.
Solved! Go to Solution.
- Mark as New
- Bookmark
- Subscribe
- Mute
- Subscribe to RSS Feed
- Permalink
- Report Inappropriate Content
Hi @pbijess857
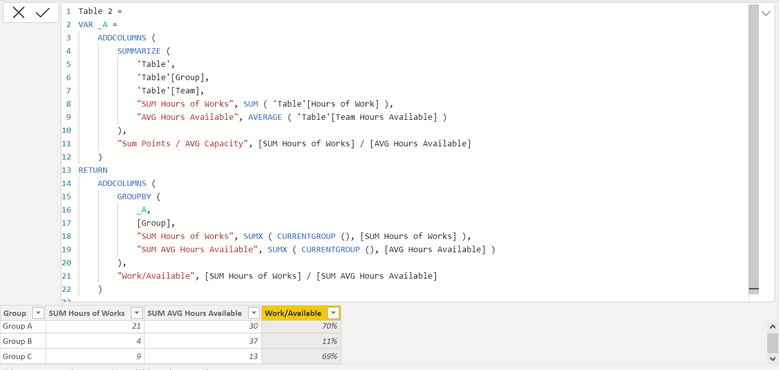
Try this code to add a new table:
Table 2 =
VAR _A =
    ADDCOLUMNS (
        SUMMARIZE (
            'Table',
            'Table'[Group],
            'Table'[Team],
            "SUM Hours of Works", SUM ( 'Table'[Hours of Work] ),
            "AVG Hours Available", AVERAGE ( 'Table'[Team Hours Available] )
        ),
        "Sum Points / AVG Capacity", [SUM Hours of Works] / [AVG Hours Available]
    )
RETURN
    ADDCOLUMNS (
        GROUPBY (
            _A,
            [Group],
            "SUM Hours of Works", SUMX ( CURRENTGROUP (), [SUM Hours of Works] ),
            "SUM AVG Hours Available", SUMX ( CURRENTGROUP (), [AVG Hours Available] )
        ),
        "Work/Available", [SUM Hours of Works] / [SUM AVG Hours Available]
    )
output:
If this post helps, please consider accepting it as the solution to help the other members find it more quickly.
Appreciate your Kudos!!
LinkedIn: www.linkedin.com/in/vahid-dm/
- Mark as New
- Bookmark
- Subscribe
- Mute
- Subscribe to RSS Feed
- Permalink
- Report Inappropriate Content
This looks like it has me back on the right track. Thank you for the help!
Helpful resources

Fabric Data Days
Advance your Data & AI career with 50 days of live learning, contests, hands-on challenges, study groups & certifications and more!

Power BI Monthly Update - October 2025
Check out the October 2025 Power BI update to learn about new features.

| User | Count |
|---|---|
| 6 | |
| 6 | |
| 4 | |
| 4 | |
| 4 |
| User | Count |
|---|---|
| 24 | |
| 17 | |
| 9 | |
| 7 | |
| 6 |


