FabCon is coming to Atlanta
Join us at FabCon Atlanta from March 16 - 20, 2026, for the ultimate Fabric, Power BI, AI and SQL community-led event. Save $200 with code FABCOMM.
Register now!- Power BI forums
- Get Help with Power BI
- Desktop
- Service
- Report Server
- Power Query
- Mobile Apps
- Developer
- DAX Commands and Tips
- Custom Visuals Development Discussion
- Health and Life Sciences
- Power BI Spanish forums
- Translated Spanish Desktop
- Training and Consulting
- Instructor Led Training
- Dashboard in a Day for Women, by Women
- Galleries
- Data Stories Gallery
- Themes Gallery
- Contests Gallery
- Quick Measures Gallery
- Visual Calculations Gallery
- Notebook Gallery
- Translytical Task Flow Gallery
- TMDL Gallery
- R Script Showcase
- Webinars and Video Gallery
- Ideas
- Custom Visuals Ideas (read-only)
- Issues
- Issues
- Events
- Upcoming Events
Calling all Data Engineers! Fabric Data Engineer (Exam DP-700) live sessions are back! Starting October 16th. Sign up.
- Power BI forums
- Forums
- Get Help with Power BI
- DAX Commands and Tips
- How to create a measure to calculate count of acti...
- Subscribe to RSS Feed
- Mark Topic as New
- Mark Topic as Read
- Float this Topic for Current User
- Bookmark
- Subscribe
- Printer Friendly Page
- Mark as New
- Bookmark
- Subscribe
- Mute
- Subscribe to RSS Feed
- Permalink
- Report Inappropriate Content
How to create a measure to calculate count of active user % in specific department in given month
Hello,
I am trying to get some help here for my dashboard. Thank you for anyone who will help in advance!
we are trying to track the % of user on a plaftform for each department, month by month.
The logic :
sum of the active user of specific department of given month / sum of the active user for the given month
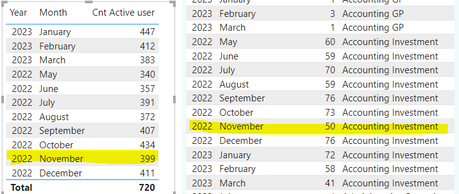
the example will be for accounting investment department active user % for Nov 2022 will be 50/399.
Notes:
1. 720 Cnt active user is a measure I created. ( logic: calculate( distinctcount(memberID), Logon='1')
2. highlighted 50 is also from cnt active user column, broken down by department.
3. my goal is to create a line chart to show the % active user of each different department month by month
- Mark as New
- Bookmark
- Subscribe
- Mute
- Subscribe to RSS Feed
- Permalink
- Report Inappropriate Content
Hi @ZhaoxiZ,
You can try to use the following measure formula on the table visual with year month as category to get correspond percentage:
formual =
DIVIDE (
    CALCULATE (
        COUNT ( Table[department] ),
        ALLSELECTED ( Table ),
        VALUES ( Table[Date] )
    ),
    CALCULATE ( [Cnt active users], ALLSELECTED ( Table ), VALUES ( Table[Date] ) )
)
Regards,
Xiaoxin Sheng
- Mark as New
- Bookmark
- Subscribe
- Mute
- Subscribe to RSS Feed
- Permalink
- Report Inappropriate Content
Hi Xiaoxin,
Thank you for the quick response, I have tried the DAX you have provide above, somhow the values are not correct. This is what I have found.
The denominator
CALCULATE ( [Cnt active users], ALLSELECTED ( Table ), VALUES ( Table[Date] ) )
is correct, it returns all the active user count for the given month.
The Numerator
CALCULATE (
        COUNT ( Table[department] ),
        ALLSELECTED ( Table ),
        VALUES ( Table[Date] )
    )
seems counting the total number of the department of the given month, it returns large numbers as below:
For 'performance' department, 2023- Feb. The 'Cnt active users' =18.
The value returned should be 18/ 412=4.37%
Three values we need for the calculation are 'Date', 'Cnt active user', 'department' becasue it shows the right numbe when I put these three columns in the view. I just dont know what synatx should I use to return the right value. Thank you for your help in advance!
- Mark as New
- Bookmark
- Subscribe
- Mute
- Subscribe to RSS Feed
- Permalink
- Report Inappropriate Content
Hi @ZhaoxiZ,
Can you please share some dummy data that keep the raw data structure with expected results? It should help us clarify your scenario and test to coding formula.
How to Get Your Question Answered Quickly
Regards,
Xiaoxin Sheng
- Mark as New
- Bookmark
- Subscribe
- Mute
- Subscribe to RSS Feed
- Permalink
- Report Inappropriate Content
Hi Xiaoxin,
Thank you! Please find the dummy data as attached below.
| ID | Date | Active_Flag | Department |
| 1 | 2023-01-01 | 0 | Performance |
| 2 | 2023-01-02 | 0 | Investment Accounting |
| 3 | 2023-01-03 | 0 | Investment Accounting |
| 4 | 2023-01-04 | 0 | Investment Accounting |
| 5 | 2023-01-05 | 1 | Investment Accounting |
| 6 | 2023-01-06 | 1 | Investment Accounting |
| 7 | 2023-01-07 | 1 | Investment Accounting |
| 8 | 2023-01-08 | 1 | Performance |
| 9 | 2023-01-09 | 1 | Performance |
| 10 | 2023-01-10 | 0 | Performance |
| 11 | 2023-01-11 | 1 | Performance |
| 12 | 2023-01-12 | 1 | Performance |
| 13 | 2023-01-13 | 1 | Performance |
| 14 | 2023-02-14 | 1 | Performance |
| 15 | 2023-02-15 | 1 | Investment Accounting |
| 16 | 2023-02-16 | 1 | Investment Accounting |
| 17 | 2023-02-17 | 1 | Investment Accounting |
| 18 | 2023-02-18 | 0 | Investment Accounting |
| 19 | 2023-02-19 | 0 | Investment Accounting |
| 20 | 2023-02-20 | 0 | Performance |
| 21 | 2023-02-21 | 0 | Performance |
| 22 | 2023-02-22 | 1 | Performance |
| 23 | 2023-02-23 | 1 | Performance |
| 24 | 2023-03-24 | 1 | Performance |
| 25 | 2023-03-25 | 1 | Performance |
| 26 | 2023-03-26 | 1 | Performance |
| 27 | 2023-03-27 | 1 | Performance |
| 28 | 2023-03-28 | 1 | Performance |
| 29 | 2023-03-29 | 1 | Investment Accounting |
| 30 | 2023-03-30 | 1 | Investment Accounting |
| 31 | 2023-03-31 | 1 | Investment Accounting |
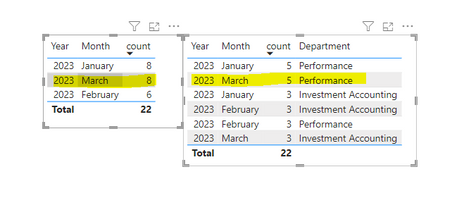
1. count: distinct count of active flag=1
2. logic: numerator =5 (count of active user for performance of given month)
denominator= 8 ( total count of the active user for the given month)
Helpful resources

FabCon Global Hackathon
Join the Fabric FabCon Global Hackathon—running virtually through Nov 3. Open to all skill levels. $10,000 in prizes!

Power BI Monthly Update - October 2025
Check out the October 2025 Power BI update to learn about new features.

| User | Count |
|---|---|
| 9 | |
| 6 | |
| 3 | |
| 3 | |
| 3 |
| User | Count |
|---|---|
| 13 | |
| 11 | |
| 9 | |
| 8 | |
| 8 |


