FabCon is coming to Atlanta
Join us at FabCon Atlanta from March 16 - 20, 2026, for the ultimate Fabric, Power BI, AI and SQL community-led event. Save $200 with code FABCOMM.
Register now!- Power BI forums
- Get Help with Power BI
- Desktop
- Service
- Report Server
- Power Query
- Mobile Apps
- Developer
- DAX Commands and Tips
- Custom Visuals Development Discussion
- Health and Life Sciences
- Power BI Spanish forums
- Translated Spanish Desktop
- Training and Consulting
- Instructor Led Training
- Dashboard in a Day for Women, by Women
- Galleries
- Data Stories Gallery
- Themes Gallery
- Contests Gallery
- Quick Measures Gallery
- Notebook Gallery
- Translytical Task Flow Gallery
- TMDL Gallery
- R Script Showcase
- Webinars and Video Gallery
- Ideas
- Custom Visuals Ideas (read-only)
- Issues
- Issues
- Events
- Upcoming Events
To celebrate FabCon Vienna, we are offering 50% off select exams. Ends October 3rd. Request your discount now.
- Power BI forums
- Forums
- Get Help with Power BI
- DAX Commands and Tips
- How to achieve Filter Logic based on two columns u...
- Subscribe to RSS Feed
- Mark Topic as New
- Mark Topic as Read
- Float this Topic for Current User
- Bookmark
- Subscribe
- Printer Friendly Page
- Mark as New
- Bookmark
- Subscribe
- Mute
- Subscribe to RSS Feed
- Permalink
- Report Inappropriate Content
How to achieve Filter Logic based on two columns using DAX
Hi,
I have a below requirements to add data into reports (filter logic); below is the scenario
We have two columns Profit % 2021 and Profit % 2020 based on these two columns we have to filter the records in report
1. Profit % 2021 < Profit % 2020; pull all the previous records along with current record onto report and use all those records to calculate total sales, revenue and other calculations.
2. Profit % 2021 > Profit % 2020; remove that customer and other details from report
3. Again if Profit % 2021 < Profit % 2020; pull all previous records into report and use all those records to calculate total sales, revenue and other calculations.
How we can achieve this?
Solved! Go to Solution.
- Mark as New
- Bookmark
- Subscribe
- Mute
- Subscribe to RSS Feed
- Permalink
- Report Inappropriate Content
Hi @apatwal ,
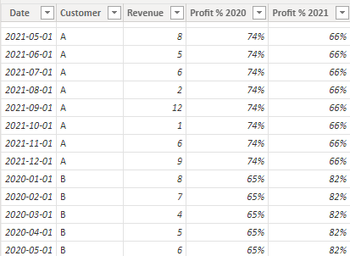
I created some data:
From the data, [Profit % 2020] of CustomerA is greater than [Profit % 2021], and [Profit % 2020] of CustomerB is less than [Profit % 2021]
Here are the steps you can follow:
1. Create measure.
Flag =
IF(
MAX('Table'[Profit % 2020])>MAX('Table'[Profit % 2021]),1,0)
AllRevenue =
SUMX(ALLSELECTED('Table'),[Revenue])The results have not been filtered
2. Place [Flag]in Filters, set is=1, apply filter.
3. Result:
After setting [Flag] to 1, according to condition 2, the data of CustomerB is deleted, leaving the data of CustomerA, and the value of [AllRevenue] will also calculate the filtered data
Best Regards,
Liu Yang
If this post helps, then please consider Accept it as the solution to help the other members find it more quickly
- Mark as New
- Bookmark
- Subscribe
- Mute
- Subscribe to RSS Feed
- Permalink
- Report Inappropriate Content
Hi,
I am not 100% if I follow but you want to filter values based on two columns in your visual? Here is one way to do this:
Test data:
Now create a slicer selection table. E.g.
Create a filter measure:

Select desired slicer:


I hope this post helps to solve your issue and if it does consider accepting it as a solution and giving the post a thumbs up!
My LinkedIn: https://www.linkedin.com/in/n%C3%A4ttiahov-00001/
Did I answer your question? Mark my post as a solution!
Proud to be a Super User!
Helpful resources
| User | Count |
|---|---|
| 15 | |
| 9 | |
| 8 | |
| 6 | |
| 5 |
| User | Count |
|---|---|
| 29 | |
| 18 | |
| 15 | |
| 7 | |
| 6 |


