Join us at FabCon Vienna from September 15-18, 2025
The ultimate Fabric, Power BI, SQL, and AI community-led learning event. Save €200 with code FABCOMM.
Get registered- Power BI forums
- Get Help with Power BI
- Desktop
- Service
- Report Server
- Power Query
- Mobile Apps
- Developer
- DAX Commands and Tips
- Custom Visuals Development Discussion
- Health and Life Sciences
- Power BI Spanish forums
- Translated Spanish Desktop
- Training and Consulting
- Instructor Led Training
- Dashboard in a Day for Women, by Women
- Galleries
- Data Stories Gallery
- Themes Gallery
- Contests Gallery
- Quick Measures Gallery
- Notebook Gallery
- Translytical Task Flow Gallery
- TMDL Gallery
- R Script Showcase
- Webinars and Video Gallery
- Ideas
- Custom Visuals Ideas (read-only)
- Issues
- Issues
- Events
- Upcoming Events
Compete to become Power BI Data Viz World Champion! First round ends August 18th. Get started.
- Power BI forums
- Forums
- Get Help with Power BI
- DAX Commands and Tips
- How much time of an hour is used
- Subscribe to RSS Feed
- Mark Topic as New
- Mark Topic as Read
- Float this Topic for Current User
- Bookmark
- Subscribe
- Printer Friendly Page
- Mark as New
- Bookmark
- Subscribe
- Mute
- Subscribe to RSS Feed
- Permalink
- Report Inappropriate Content
How much time of an hour is used
Hi all,
Apologies if this has been queried before, and also for the poor subject description, I'm not really sure how to word it.
I am trying to chart data to show the down time of a machine. The information is a live link, but it is fed differently to the hourly production numbers data that comes through. I get a start and end time to the machine being down (in Epoch time but I've got the translator in place).
The issue is I get the production numbers as a number made per hour. What I want to do is show the downtime as a number of minutes per hour in a parallel chart. While I can get the number of minutes the machine is down from the epoch time, as well as when it was, I can't figure out a way of spreading it out and charting it on the hourly graph.
So for example, if the machine was down from 00:30 to 02:15 for a total of 105 minutes, I want the graph to show 30 minutes in 00:00, 60 minutes in 01:00 then 15 minutes in 02:15. It also needs to be dynamic and calculate the live data as its fed in.
Any help would be greatly appreciated.
Thanks,
Solved! Go to Solution.
- Mark as New
- Bookmark
- Subscribe
- Mute
- Subscribe to RSS Feed
- Permalink
- Report Inappropriate Content
Hi @benji1908
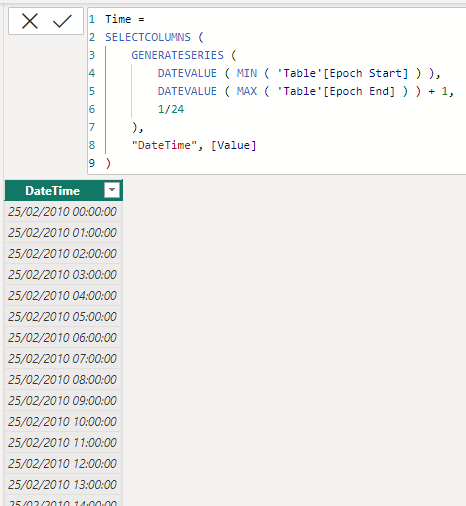
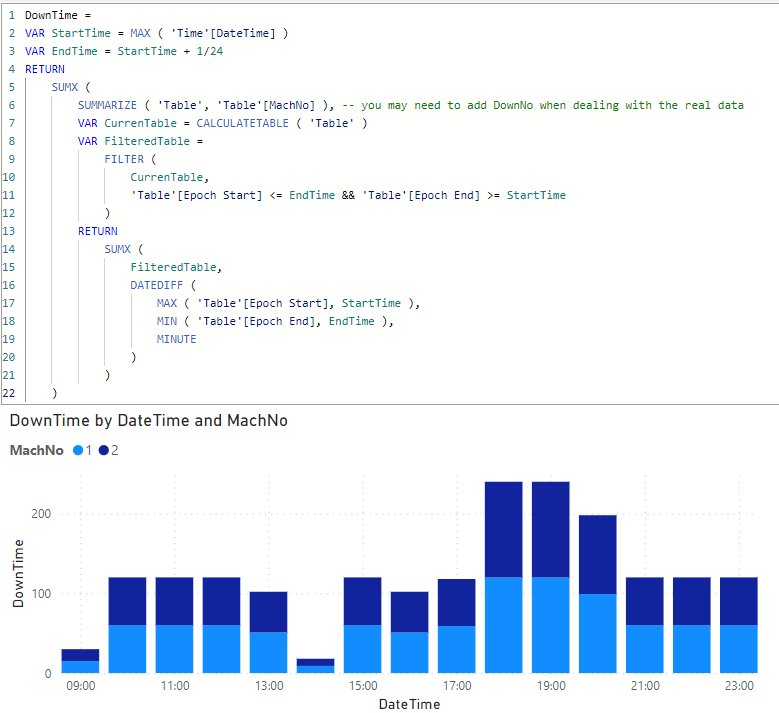
One aproach is by using a date table. As long as you are working no less that hourly level then it should be fine otherwise the time table would be huge. Please refer to attached sample file and screenshots
DownTime =
VAR StartTime = MAX ( 'Time'[DateTime] )
VAR EndTime = StartTime + 1/24
RETURN
    SUMX (
        SUMMARIZE ( 'Table', 'Table'[MachNo] ), -- you may need to add DownNo when dealing with the real data
        VAR CurrenTable = CALCULATETABLE ( 'Table' )
        VAR FilteredTable =
            FILTER (
                CurrenTable,
                'Table'[Epoch Start] <= EndTime && 'Table'[Epoch End] >= StartTime
            )
        RETURN
            SUMX (
                FilteredTable,
                DATEDIFF (
                    MAX ( 'Table'[Epoch Start], StartTime ),
                    MIN ( 'Table'[Epoch End], EndTime ),
                    MINUTE
                )
            )
)- Mark as New
- Bookmark
- Subscribe
- Mute
- Subscribe to RSS Feed
- Permalink
- Report Inappropriate Content
Hi Ben,
no worry. Everybody had a start some years,weeks or days ago with Power BI 🙂
If you have only the down time, it is no problem. Can you upload your sample data via the internal table function of the forum or can you upload a PBI File which the sample data? Than I show you how to create the table and visual. You need a "bridge" table to get for every day, hour your correct machine state.
Did I answer your question? Mark my post as a solution!
Proud to be a Super User!
- Mark as New
- Bookmark
- Subscribe
- Mute
- Subscribe to RSS Feed
- Permalink
- Report Inappropriate Content
I visualize some years ago also machine states, nice topic :).
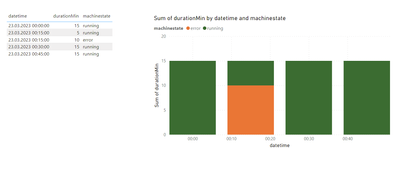
I used a dimtable with timedate in 15 min slots. Than I calculated the state of the maschine during this time from the machine data tables.
| Datetime | machinestate | durationMinute |
| 23.03.2023 00:00:00 | running | 15 |
| 23.03.2023 00:15:00 | error | 10 |
| 23.03.2023 00:15:00 | running | 5 |
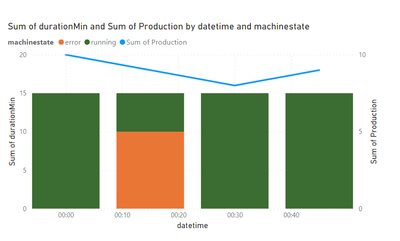
Than I can bring the datime to the x axis, duration to the y axsis and machine state as a legend.
A second column you can but the production volumn in this time.
Did it help? Perhaps you can show some example data for the machine data (wihtout sensitive data).
Did I answer your question? Mark my post as a solution!
Proud to be a Super User!
- Mark as New
- Bookmark
- Subscribe
- Mute
- Subscribe to RSS Feed
- Permalink
- Report Inappropriate Content
Hi, thanks for your response.
So the data looks like this:
The data is fairly simplistic but feeds in differently to the production numbers. Machine number and downtime reason get referenced on another table to translate the proper data.
There is no live feed for machine running times, only when it's down. As I said it's in Epoch but I translated that, and can get it to align to an hourly chart but I only have start and end times as a reference. So if the machine went down for 2 hours, I could put it in based on it's start time, but then it would show that hour as having 120 minutes downtime for that hour.
I need it to spread and fill the hours up, then spill over to the next. So if I have downtime starting at 00:45 and ending at 01:10, I need it to tell me 15 minutes in the first hour, then cut it off and know that the remaining 10 minutes belong in the second hour.
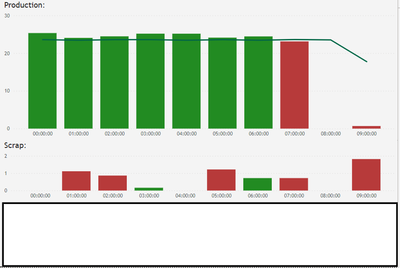
Then I want to be able to chart it, like I have with the scrap below the production:
I'm very much an amatuer at Power BI and only know the basics so I'm not sure if I'm missing something obvious here.
Thanks
Ben
Helpful resources
| User | Count |
|---|---|
| 16 | |
| 8 | |
| 6 | |
| 6 | |
| 5 |
| User | Count |
|---|---|
| 23 | |
| 13 | |
| 13 | |
| 8 | |
| 8 |
