FabCon is coming to Atlanta
Join us at FabCon Atlanta from March 16 - 20, 2026, for the ultimate Fabric, Power BI, AI and SQL community-led event. Save $200 with code FABCOMM.
Register now!- Power BI forums
- Get Help with Power BI
- Desktop
- Service
- Report Server
- Power Query
- Mobile Apps
- Developer
- DAX Commands and Tips
- Custom Visuals Development Discussion
- Health and Life Sciences
- Power BI Spanish forums
- Translated Spanish Desktop
- Training and Consulting
- Instructor Led Training
- Dashboard in a Day for Women, by Women
- Galleries
- Data Stories Gallery
- Themes Gallery
- Contests Gallery
- QuickViz Gallery
- Quick Measures Gallery
- Visual Calculations Gallery
- Notebook Gallery
- Translytical Task Flow Gallery
- TMDL Gallery
- R Script Showcase
- Webinars and Video Gallery
- Ideas
- Custom Visuals Ideas (read-only)
- Issues
- Issues
- Events
- Upcoming Events
View all the Fabric Data Days sessions on demand. View schedule
- Power BI forums
- Forums
- Get Help with Power BI
- DAX Commands and Tips
- Flag account if something has happened for 3 conse...
- Subscribe to RSS Feed
- Mark Topic as New
- Mark Topic as Read
- Float this Topic for Current User
- Bookmark
- Subscribe
- Printer Friendly Page
- Mark as New
- Bookmark
- Subscribe
- Mute
- Subscribe to RSS Feed
- Permalink
- Report Inappropriate Content
Flag account if something has happened for 3 consecutive months
Hi everyone! I'm trying to identify when an account is uninsured for >= 3 months in a row. My data (example in screenshot) will count each day that an account is uninsured. If the count is >1 it should show as uninsured for the whole month.
I need a way to flag the accounts that have been uninsured for >=3 months reguardless of when it happened. In the screenshot below, I'd need to flag accounts 456 and 789 but NOT 123. I hope this makes sense, please let me know if you have additional questions.
Solved! Go to Solution.
- Mark as New
- Bookmark
- Subscribe
- Mute
- Subscribe to RSS Feed
- Permalink
- Report Inappropriate Content
Hi @Syk
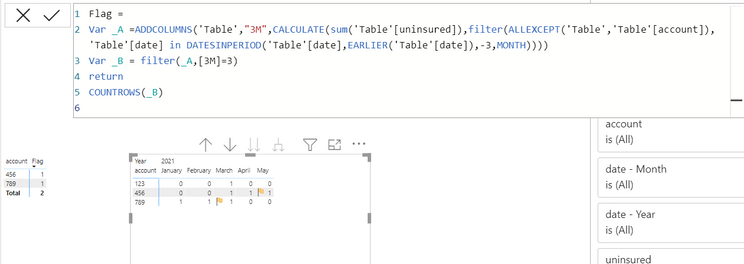
Try this measure to find the Accounts with 3 month uninsured 1 in line:
Flag =
Var _A =ADDCOLUMNS('Table',"3M",CALCULATE(sum('Table'[uninsured]),filter(ALLEXCEPT('Table','Table'[account]),'Table'[date] in DATESINPERIOD('Table'[date],EARLIER('Table'[date]),-3,MONTH))))
Var _B = filter(_A,[3M]=3)
return
COUNTROWS(_B)
then you can use that in the conditional formatting of your visual.
output:
If this post helps, please consider accepting it as the solution to help the other members find it more quickly.
Appreciate your Kudos!!
LinkedIn: www.linkedin.com/in/vahid-dm/
Helpful resources

Power BI Monthly Update - November 2025
Check out the November 2025 Power BI update to learn about new features.

Fabric Data Days
Advance your Data & AI career with 50 days of live learning, contests, hands-on challenges, study groups & certifications and more!

| User | Count |
|---|---|
| 19 | |
| 11 | |
| 9 | |
| 4 | |
| 4 |
| User | Count |
|---|---|
| 31 | |
| 27 | |
| 21 | |
| 13 | |
| 12 |


