FabCon is coming to Atlanta
Join us at FabCon Atlanta from March 16 - 20, 2026, for the ultimate Fabric, Power BI, AI and SQL community-led event. Save $200 with code FABCOMM.
Register now!- Power BI forums
- Get Help with Power BI
- Desktop
- Service
- Report Server
- Power Query
- Mobile Apps
- Developer
- DAX Commands and Tips
- Custom Visuals Development Discussion
- Health and Life Sciences
- Power BI Spanish forums
- Translated Spanish Desktop
- Training and Consulting
- Instructor Led Training
- Dashboard in a Day for Women, by Women
- Galleries
- Data Stories Gallery
- Themes Gallery
- Contests Gallery
- QuickViz Gallery
- Quick Measures Gallery
- Visual Calculations Gallery
- Notebook Gallery
- Translytical Task Flow Gallery
- TMDL Gallery
- R Script Showcase
- Webinars and Video Gallery
- Ideas
- Custom Visuals Ideas (read-only)
- Issues
- Issues
- Events
- Upcoming Events
The Power BI Data Visualization World Championships is back! Get ahead of the game and start preparing now! Learn more
- Power BI forums
- Forums
- Get Help with Power BI
- DAX Commands and Tips
- Filter within calculate does not filter other visu...
- Subscribe to RSS Feed
- Mark Topic as New
- Mark Topic as Read
- Float this Topic for Current User
- Bookmark
- Subscribe
- Printer Friendly Page
- Mark as New
- Bookmark
- Subscribe
- Mute
- Subscribe to RSS Feed
- Permalink
- Report Inappropriate Content
Filter within calculate does not filter other visual
Hello,
I am new to Power BI and have been stuck with the issue that the filter in a Calculate function does not affect the filter context for another visual. I have created a small example. There is 1 table which holds responses to a survey for 3 customers. There are 4 columns: “Customer”, “Yes/No”, “Category” & “Question”. To make checking easier, each customer with “Yes” or “” in the “Yes/No” column has Category “Cat 1” and customers with “No” have category “Cat 2”.
Table = SELECTCOLUMNS( {
    ("Q1", "Customer 1", "Cat 1", "Yes"),
    ("Q2", "Customer 1", "Cat 1", "Yes"),
    ("Q3", "Customer 1", "Cat 2", "No"),
    ("Q4", "Customer 1", "Cat 1", ""),
    ("Q1", "Customer 2", "Cat 1", "Yes"),
    ("Q2", "Customer 2", "Cat 2", "No"),
    ("Q3", "Customer 2", "Cat 2", "No"),
    ("Q4", "Customer 2", "Cat 1", ""),
    ("Q1", "Customer 3", "Cat 1", "Yes"),
    ("Q2", "Customer 3", "Cat 1", "Yes"),
    ("Q3", "Customer 3", "Cat 2", "No"),
    ("Q4", "Customer 3", "Cat 1", "")
},
"Question", [Value1],
"Customer", [Value2],
"Category", [Value3],
"Yes/No", [Value4])
I have a measure to calculate the number of rows that are not blank in the “Yes/No” column.
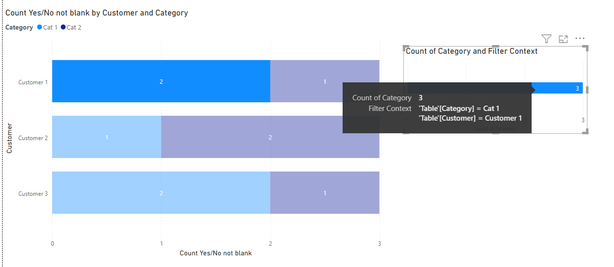
Count Yes/No not blank = CALCULATE(COUNTROWS('Table'), 'Table'[Yes/No] <> "")A Stacked bar chart is created with the Customer on the Y-axis and the measure on the X-axis. In the legend is the category. On the right of the bar chart there is another bar chart that shows the count of category (which represents the count of rows as the category is always filled).
The problem is that when a category is selected, the count of category still includes the rows that are blank in column “Yes/No” as the filter from within the calculate function is not in the filter context for the count of category (Filter context is extracted from DAX studio and displayed in the tooltip).
I would like to not use the “Filter on this visual” to prevent users of the report to change the filter on Yes/No as the blank rows should always be filtered out.
What should I change to have the filter on the “Yes/No” column also applied to the count of category visual?
Solved! Go to Solution.
- Mark as New
- Bookmark
- Subscribe
- Mute
- Subscribe to RSS Feed
- Permalink
- Report Inappropriate Content
Hi @Anonymous ,
Power BI does not support the direct passing of filters between our visual1 to visual2.
If you want your visual show data that "Yes/No" is not the blank, I think you need to add the filter into the calculation.
I think you can use measure [Count Yes/No not blank] in your visual on right side instead of count Category directly.
Count Yes/No not blank = CALCULATE(COUNTROWS('Table'), 'Table'[Yes/No] <> "")
Best Regards,
Rico Zhou
If this post helps, then please consider Accept it as the solution to help the other members find it more quickly.
Helpful resources

Power BI Monthly Update - November 2025
Check out the November 2025 Power BI update to learn about new features.

Fabric Data Days
Advance your Data & AI career with 50 days of live learning, contests, hands-on challenges, study groups & certifications and more!

| User | Count |
|---|---|
| 20 | |
| 10 | |
| 9 | |
| 4 | |
| 4 |
| User | Count |
|---|---|
| 34 | |
| 31 | |
| 19 | |
| 12 | |
| 10 |


