FabCon is coming to Atlanta
Join us at FabCon Atlanta from March 16 - 20, 2026, for the ultimate Fabric, Power BI, AI and SQL community-led event. Save $200 with code FABCOMM.
Register now!- Power BI forums
- Get Help with Power BI
- Desktop
- Service
- Report Server
- Power Query
- Mobile Apps
- Developer
- DAX Commands and Tips
- Custom Visuals Development Discussion
- Health and Life Sciences
- Power BI Spanish forums
- Translated Spanish Desktop
- Training and Consulting
- Instructor Led Training
- Dashboard in a Day for Women, by Women
- Galleries
- Data Stories Gallery
- Themes Gallery
- Contests Gallery
- Quick Measures Gallery
- Notebook Gallery
- Translytical Task Flow Gallery
- TMDL Gallery
- R Script Showcase
- Webinars and Video Gallery
- Ideas
- Custom Visuals Ideas (read-only)
- Issues
- Issues
- Events
- Upcoming Events
To celebrate FabCon Vienna, we are offering 50% off select exams. Ends October 3rd. Request your discount now.
- Power BI forums
- Forums
- Get Help with Power BI
- DAX Commands and Tips
- Date slicer with toggle to include/exclude "blank"...
- Subscribe to RSS Feed
- Mark Topic as New
- Mark Topic as Read
- Float this Topic for Current User
- Bookmark
- Subscribe
- Printer Friendly Page
- Mark as New
- Bookmark
- Subscribe
- Mute
- Subscribe to RSS Feed
- Permalink
- Report Inappropriate Content
Date slicer with toggle to include/exclude "blank" dates and plot points onto mapping visual
Hi All,
I am looking to create a map in which the points (long and lat.) are filterable by a date slicer and have a toggle that includes/excludes blank dates.
The issue concerns the treatment of blank/"null" dates whilst using slicer. I do not believe there is a solution.
I have tried:
- using a variable input from user (slicer outputting a value with with "selectedvalue" measure) - similar to this post: https://community.powerbi.com/t5/Desktop/OR-include-blank-values-in-date-slicer/td-p/959529
- restructuring data/queries (e.g. duplicating the data set three times over for each scenario)
- other
Simply having a drop-down list whereby the user selecs the date and "blank" checkbox isnt a neat solution when looking across years of dates.
Thanks,
****EDIT: I am aware of the method using measures as user-input variables - however to my knowledge this does not work for maps (long. lat. inputs) as the measure neds to return a table of circa 10,000 lat. and longs. which would take too much computing time when looking at a published dashboard product.
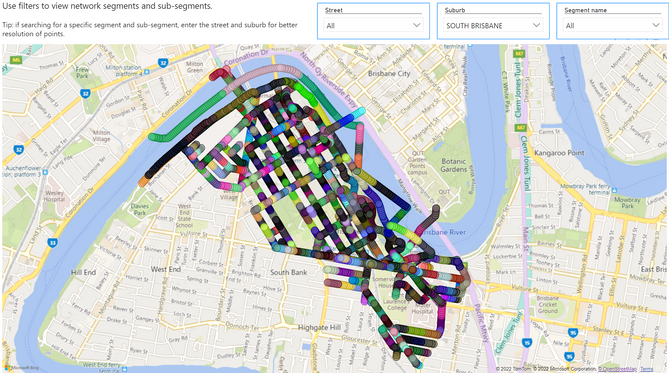
To give you an idea, the below is a small aea of a larger network. The date filter is being used on each of those segments (noted by colour here). Recalculating the measure every time a filter is touched will take too long (the final data set may be in the order of 1-2 million points).
My current approach is to exclude all blank dates and show on another page/tab.
- Mark as New
- Bookmark
- Subscribe
- Mute
- Subscribe to RSS Feed
- Permalink
- Report Inappropriate Content
Thanks v-jianboli-msft
Using measures as user-input variables works for other visuals. To my knowledge it does not work for plotting many points onto a map (i.e. putting a measure into the long and lat fields for say 10,000 points does not work (and if there is a way to make this work, calculating such a measure would make it too slow once published)
- Mark as New
- Bookmark
- Subscribe
- Mute
- Subscribe to RSS Feed
- Permalink
- Report Inappropriate Content
Hi @Anonymous ,
Based on your description, I have created a simple sample:
Please try:
First, create a new table for slicer:
Then create a slicer and turn on the single select:
Then apply the measure to the visual level filter:
Measure =
IF (
    SWITCH (
        SELECTEDVALUE ( 'For Slicer'[Value] ),
        "Exclude", NOT ( ISBLANK ( MAX ( 'Table'[Date] ) ) ),
        "Include", TRUE ()
    ),
    1,
    0
)
Final output:
Best Regards,
Jianbo Li
If this post helps, then please consider Accept it as the solution to help the other members find it more quickly.


