Party with Power BI’s own Guy in a Cube
Power BI is turning 10! Tune in for a special live episode on July 24 with behind-the-scenes stories, product evolution highlights, and a sneak peek at what’s in store for the future.
Save the date- Power BI forums
- Get Help with Power BI
- Desktop
- Service
- Report Server
- Power Query
- Mobile Apps
- Developer
- DAX Commands and Tips
- Custom Visuals Development Discussion
- Health and Life Sciences
- Power BI Spanish forums
- Translated Spanish Desktop
- Training and Consulting
- Instructor Led Training
- Dashboard in a Day for Women, by Women
- Galleries
- Data Stories Gallery
- Themes Gallery
- Contests Gallery
- Quick Measures Gallery
- Notebook Gallery
- Translytical Task Flow Gallery
- TMDL Gallery
- R Script Showcase
- Webinars and Video Gallery
- Ideas
- Custom Visuals Ideas (read-only)
- Issues
- Issues
- Events
- Upcoming Events
Enhance your career with this limited time 50% discount on Fabric and Power BI exams. Ends August 31st. Request your voucher.
- Power BI forums
- Forums
- Get Help with Power BI
- DAX Commands and Tips
- Counting between 2 date columns, need formula to n...
- Subscribe to RSS Feed
- Mark Topic as New
- Mark Topic as Read
- Float this Topic for Current User
- Bookmark
- Subscribe
- Printer Friendly Page
- Mark as New
- Bookmark
- Subscribe
- Mute
- Subscribe to RSS Feed
- Permalink
- Report Inappropriate Content
Counting between 2 date columns, need formula to now return the Distinct Count
Solved! Go to Solution.
- Mark as New
- Bookmark
- Subscribe
- Mute
- Subscribe to RSS Feed
- Permalink
- Report Inappropriate Content
Hi @6Rastaman9 ,
Please update the formula of measure [# of Cases (RoleDate)] as below and check if you can get the correct result...
# of Cases (RoleDate) =
VAR _seldate =
    SELECTEDVALUE ( 'Calendar'[Date] )
RETURN
    CALCULATE (
        DISTINCTCOUNT ( MainData[CaseNumber] ),
        FILTER (
            MainData,
            MainData[RoleStartDate] <= _seldate
                && COALESCE ( MainData[RoleEndDate], TODAY () ) >= _seldate
        )
    )
If the above one can't help you get the desired result, please provide some sample data in your table 'MainData' (exclude sensitive data) with Text format and your expected result with backend logic and special examples. It is better if you can share a simplified pbix file. You can refer the following link to upload the file to the community. Thank you.
How to upload PBI in Community
Best Regards
- Mark as New
- Bookmark
- Subscribe
- Mute
- Subscribe to RSS Feed
- Permalink
- Report Inappropriate Content
Thanks, very informative but not sure its what I need in this senerio. I may not be expressing it accurately.
I used your formula below which worked! but bc I now have mutiple rows of the same case # in my fact table, this formula is counting each row, therefore the same case # is being counted multiple times.
In my table I need to count distinct cases equalling 2 total cases in 2020 (start date) and those same 2 total cases in 2021 (end in 2021 so still counted as cases). I do have a Date table as well.
Here is what I used, how do I now calculate the distinct cases? ANY help would so be appreciated.
- Mark as New
- Bookmark
- Subscribe
- Mute
- Subscribe to RSS Feed
- Permalink
- Report Inappropriate Content
Hi @6Rastaman9 ,
Please update the formula of measure [# of Cases (RoleDate)] as below and check if you can get the correct result...
# of Cases (RoleDate) =
VAR _seldate =
    SELECTEDVALUE ( 'Calendar'[Date] )
RETURN
    CALCULATE (
        DISTINCTCOUNT ( MainData[CaseNumber] ),
        FILTER (
            MainData,
            MainData[RoleStartDate] <= _seldate
                && COALESCE ( MainData[RoleEndDate], TODAY () ) >= _seldate
        )
    )
If the above one can't help you get the desired result, please provide some sample data in your table 'MainData' (exclude sensitive data) with Text format and your expected result with backend logic and special examples. It is better if you can share a simplified pbix file. You can refer the following link to upload the file to the community. Thank you.
How to upload PBI in Community
Best Regards
- Mark as New
- Bookmark
- Subscribe
- Mute
- Subscribe to RSS Feed
- Permalink
- Report Inappropriate Content
@Anonymous it works! Thank you so so much :).
2 follow up Qs if I may:
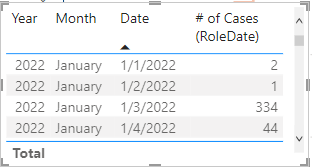
1 - I noticed that the # of cases doesnt total:
2 - Is it because I do not have a date hierarchy that I cant get the totals for just January or just the year? Choosing 2022 shows a Blank in a card visual.
- Mark as New
- Bookmark
- Subscribe
- Mute
- Subscribe to RSS Feed
- Permalink
- Report Inappropriate Content
Hi @6Rastaman9 ,
You can create a measure as below and put this measure on the card visual to replace the original measure [# of Cases (RoleDate)] and check if it can return the expected result...
Measure =
SUMX (
    GROUPBY ( 'Calendar', 'Calendar'[Year], 'Calendar'[Month], 'Calendar'[Date] ),
    [# of Cases (RoleDate)]
)
Best Regards
- Mark as New
- Bookmark
- Subscribe
- Mute
- Subscribe to RSS Feed
- Permalink
- Report Inappropriate Content
@6Rastaman9 , You can have a separate year table and use the way given below
Between Dates - Dates between
Measure way
Power BI Dax Measure- Allocate data between Range: https://youtu.be/O653vwLTUzM
https://community.powerbi.com/t5/Community-Blog/How-to-divide-distribute-values-between-start-date-o...
Helpful resources
| User | Count |
|---|---|
| 25 | |
| 12 | |
| 8 | |
| 6 | |
| 6 |
| User | Count |
|---|---|
| 26 | |
| 12 | |
| 11 | |
| 9 | |
| 6 |


