Fabric Data Days starts November 4th!
Advance your Data & AI career with 50 days of live learning, dataviz contests, hands-on challenges, study groups & certifications and more!
Get registered- Power BI forums
- Get Help with Power BI
- Desktop
- Service
- Report Server
- Power Query
- Mobile Apps
- Developer
- DAX Commands and Tips
- Custom Visuals Development Discussion
- Health and Life Sciences
- Power BI Spanish forums
- Translated Spanish Desktop
- Training and Consulting
- Instructor Led Training
- Dashboard in a Day for Women, by Women
- Galleries
- Data Stories Gallery
- Themes Gallery
- Contests Gallery
- QuickViz Gallery
- Quick Measures Gallery
- Visual Calculations Gallery
- Notebook Gallery
- Translytical Task Flow Gallery
- TMDL Gallery
- R Script Showcase
- Webinars and Video Gallery
- Ideas
- Custom Visuals Ideas (read-only)
- Issues
- Issues
- Events
- Upcoming Events
Get Fabric Certified for FREE during Fabric Data Days. Don't miss your chance! Request now
- Power BI forums
- Forums
- Get Help with Power BI
- DAX Commands and Tips
- Count of Counts
- Subscribe to RSS Feed
- Mark Topic as New
- Mark Topic as Read
- Float this Topic for Current User
- Bookmark
- Subscribe
- Printer Friendly Page
- Mark as New
- Bookmark
- Subscribe
- Mute
- Subscribe to RSS Feed
- Permalink
- Report Inappropriate Content
Count of Counts
Hello,
I am going to try this again, last time I posted it was marked as spam. I think it was because it was my first post and I included a link to a sample .pbix from my OneDrive.
I need to make a visualization of the counts of how many times people visited. The visits are represented like this:
| ContactID | Date |
| 1 | 1/1/2021 |
| 1 | 1/2/2021 |
| 2 | 1/1/2021 |
| 3 | 1/1/2021 |
| 3 | 1/2/2021 |
| 3 | 1/3/2021 |
| 4 | 1/1/2021 |
| 5 | 1/1/2021 |
| 5 | 1/2/2021 |
| 5 | 1/3/2021 |
| 5 | 1/4/2021 |
| 5 | 1/5/2021 |
| 6 | 1/1/2021 |
| 6 | 1/2/2021 |
| 7 | 1/1/2021 |
| 8 | 1/1/2021 |
| 9 | 1/1/2021 |
| 9 | 1/2/2021 |
| 9 | 1/3/2021 |
I have a measure that will give me the number of visits by ContactID:
| ContactID | Visits |
| 1 | 2 |
| 2 | 1 |
| 3 | 3 |
| 4 | 1 |
| 5 | 5 |
| 6 | 2 |
| 7 | 1 |
| 8 | 1 |
| 9 | 3 |
This is where I get lost. Somehow I need to get it to count these counts which could be represented like this:
| Visits | Count of Visitors |
| 1 | 4 |
| 2 | 2 |
| 3 | 2 |
| 4 | 0 |
| 5 | 1 |
Which lastly needs to be visualized like this:
Any help would be greatly appreciated!
Thank you!
David
Solved! Go to Solution.
- Mark as New
- Bookmark
- Subscribe
- Mute
- Subscribe to RSS Feed
- Permalink
- Report Inappropriate Content
Hi @d2hughes
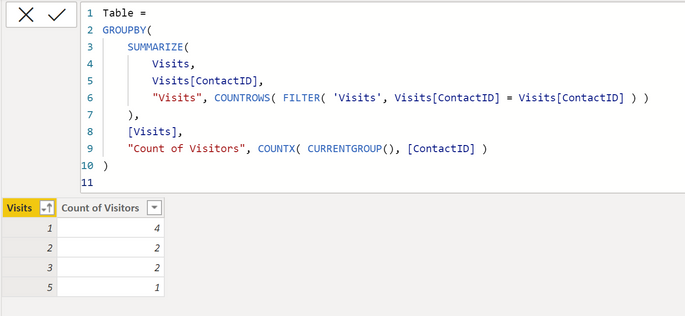
Try this code to create a new table:
Table =
GROUPBY(
    SUMMARIZE(
        Visits,
        Visits[ContactID],
        "Visits", COUNTROWS( FILTER( 'Visits', Visits[ContactID] = Visits[ContactID] ) )
    ),
    [Visits],
    "Count of Visitors", COUNTX( CURRENTGROUP(), [ContactID] )
)
output:
If this post helps, please consider accepting it as the solution to help the other members find it more quickly.
Appreciate your Kudos!!
LinkedIn: www.linkedin.com/in/vahid-dm/
- Mark as New
- Bookmark
- Subscribe
- Mute
- Subscribe to RSS Feed
- Permalink
- Report Inappropriate Content
Yes this looks correct! I made this a simple sample but it should translate to the actual data I am working on.
Thank you so much!
- Mark as New
- Bookmark
- Subscribe
- Mute
- Subscribe to RSS Feed
- Permalink
- Report Inappropriate Content
Hi @d2hughes
Try this code to create a new table:
Table =
GROUPBY(
    SUMMARIZE(
        Visits,
        Visits[ContactID],
        "Visits", COUNTROWS( FILTER( 'Visits', Visits[ContactID] = Visits[ContactID] ) )
    ),
    [Visits],
    "Count of Visitors", COUNTX( CURRENTGROUP(), [ContactID] )
)
output:
If this post helps, please consider accepting it as the solution to help the other members find it more quickly.
Appreciate your Kudos!!
LinkedIn: www.linkedin.com/in/vahid-dm/
- Mark as New
- Bookmark
- Subscribe
- Mute
- Subscribe to RSS Feed
- Permalink
- Report Inappropriate Content
Sorry, I forgot one caveat. I need to be able to slice it by the date column. This table works fine for the whole data set but it is unaffected by a slicer on the base table's date. Any ideas?
Helpful resources

Fabric Data Days
Advance your Data & AI career with 50 days of live learning, contests, hands-on challenges, study groups & certifications and more!

Power BI Monthly Update - October 2025
Check out the October 2025 Power BI update to learn about new features.

| User | Count |
|---|---|
| 8 | |
| 6 | |
| 5 | |
| 5 | |
| 4 |
| User | Count |
|---|---|
| 25 | |
| 16 | |
| 8 | |
| 7 | |
| 7 |


