FabCon is coming to Atlanta
Join us at FabCon Atlanta from March 16 - 20, 2026, for the ultimate Fabric, Power BI, AI and SQL community-led event. Save $200 with code FABCOMM.
Register now!- Power BI forums
- Get Help with Power BI
- Desktop
- Service
- Report Server
- Power Query
- Mobile Apps
- Developer
- DAX Commands and Tips
- Custom Visuals Development Discussion
- Health and Life Sciences
- Power BI Spanish forums
- Translated Spanish Desktop
- Training and Consulting
- Instructor Led Training
- Dashboard in a Day for Women, by Women
- Galleries
- Data Stories Gallery
- Themes Gallery
- Contests Gallery
- Quick Measures Gallery
- Visual Calculations Gallery
- Notebook Gallery
- Translytical Task Flow Gallery
- TMDL Gallery
- R Script Showcase
- Webinars and Video Gallery
- Ideas
- Custom Visuals Ideas (read-only)
- Issues
- Issues
- Events
- Upcoming Events
Calling all Data Engineers! Fabric Data Engineer (Exam DP-700) live sessions are back! Starting October 16th. Sign up.
- Power BI forums
- Forums
- Get Help with Power BI
- DAX Commands and Tips
- Computing totals by summing visible values (based ...
- Subscribe to RSS Feed
- Mark Topic as New
- Mark Topic as Read
- Float this Topic for Current User
- Bookmark
- Subscribe
- Printer Friendly Page
- Mark as New
- Bookmark
- Subscribe
- Mute
- Subscribe to RSS Feed
- Permalink
- Report Inappropriate Content
Computing totals by summing visible values (based on measure) row by row in DAX
Hi,
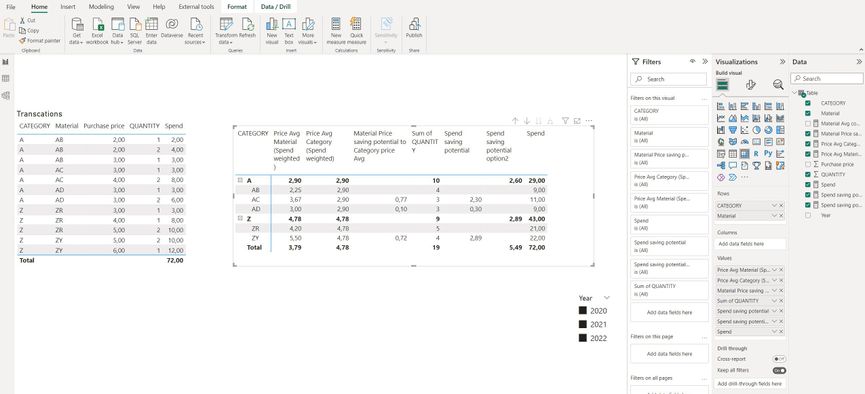
I have a issue to calculate a measure in a way that it gives the result on row level and on total level in the same measure.
I have managed to calculate two different measures, neither of those give the proper putcome.
As can be seen in the picture below, the "Spend saving potential" is the aggregated savings of materials where the material average price is over the correspondedcategory averages. If material prices are under category avg prices, those are blanked out.
The link PBIX file
https://drive.google.com/file/d/19DQW4kovKCk9zn6OkPCqJty0aLc3zkzj/view?usp=sharing
Thanks if you can solve this!
Solved! Go to Solution.
- Mark as New
- Bookmark
- Subscribe
- Mute
- Subscribe to RSS Feed
- Permalink
- Report Inappropriate Content
Thank you for direct sharing your PBI. I make it more easier for helping.
Try this
Combine =
VAR _cat = CALCULATE(
SUMX('Table', 'Table'[QUANTITY])
*
[Material Price saving potential to Category price Avg]
)

VAR _mat = SUMX(
    VALUES('Table'[Material]),
    IF([Spend saving potential] >0, [Spend saving potential]))
RETURN

IF(HASONEFILTER('Table'[Material]),_cat,_mat)
Did I answer your question? Mark my post as a solution!
Proud to be a Super User!
- Mark as New
- Bookmark
- Subscribe
- Mute
- Subscribe to RSS Feed
- Permalink
- Report Inappropriate Content
Hi,
The proposed solution was good enough for the time being, so I accepted yi as solution.
Thank you @andhiii079845 !
- Mark as New
- Bookmark
- Subscribe
- Mute
- Subscribe to RSS Feed
- Permalink
- Report Inappropriate Content
I have to look later in the pbi again to answer your question in general you want to combine to different measures which have different filters and one a "group by" per 'Table'[Material] . So you have to decide what you want to show when.
In other words, I am lacking understanding why "Spend saving potential" does not produce value for total?
And also lacking understanding why "option2" does not give values for matrix rows.
Do you mean no totals of the level of the Category? Can you explain more in detail what do you not understand, please? I think (not 100 % sure) you have blank values in the measure ([Material Price saving potential to Category price Avg]) so he can not give a total back for the category or total.
Did I answer your question? Mark my post as a solution!
Proud to be a Super User!
- Mark as New
- Bookmark
- Subscribe
- Mute
- Subscribe to RSS Feed
- Permalink
- Report Inappropriate Content
Thank you for direct sharing your PBI. I make it more easier for helping.
Try this
Combine =
VAR _cat = CALCULATE(
SUMX('Table', 'Table'[QUANTITY])
*
[Material Price saving potential to Category price Avg]
)

VAR _mat = SUMX(
    VALUES('Table'[Material]),
    IF([Spend saving potential] >0, [Spend saving potential]))
RETURN

IF(HASONEFILTER('Table'[Material]),_cat,_mat)
Did I answer your question? Mark my post as a solution!
Proud to be a Super User!
- Mark as New
- Bookmark
- Subscribe
- Mute
- Subscribe to RSS Feed
- Permalink
- Report Inappropriate Content
Hi,
Thanks for your answer @andhiii079845
In a way, this resolve the case.
However I wonder is there more "sophicticated / simplified" measure, which would automatically calculate desired outcome (one code for rows and also for totals) without using this kind of "workaround" where the code is longer and more complicated.
In other words, I am lacking understanding why "Spend saving potential" does not produce value for total? And also lacking understanding why "option2" does not give values for matrix rows.
Thanks for support!
Helpful resources

FabCon Global Hackathon
Join the Fabric FabCon Global Hackathon—running virtually through Nov 3. Open to all skill levels. $10,000 in prizes!

Power BI Monthly Update - October 2025
Check out the October 2025 Power BI update to learn about new features.

| User | Count |
|---|---|
| 12 | |
| 11 | |
| 10 | |
| 9 | |
| 8 |

