FabCon is coming to Atlanta
Join us at FabCon Atlanta from March 16 - 20, 2026, for the ultimate Fabric, Power BI, AI and SQL community-led event. Save $200 with code FABCOMM.
Register now!- Power BI forums
- Get Help with Power BI
- Desktop
- Service
- Report Server
- Power Query
- Mobile Apps
- Developer
- DAX Commands and Tips
- Custom Visuals Development Discussion
- Health and Life Sciences
- Power BI Spanish forums
- Translated Spanish Desktop
- Training and Consulting
- Instructor Led Training
- Dashboard in a Day for Women, by Women
- Galleries
- Data Stories Gallery
- Themes Gallery
- Contests Gallery
- QuickViz Gallery
- Quick Measures Gallery
- Visual Calculations Gallery
- Notebook Gallery
- Translytical Task Flow Gallery
- TMDL Gallery
- R Script Showcase
- Webinars and Video Gallery
- Ideas
- Custom Visuals Ideas (read-only)
- Issues
- Issues
- Events
- Upcoming Events
Get Fabric Certified for FREE during Fabric Data Days. Don't miss your chance! Request now
- Power BI forums
- Forums
- Get Help with Power BI
- DAX Commands and Tips
- Re: Applying Measure after Multiple Selection
- Subscribe to RSS Feed
- Mark Topic as New
- Mark Topic as Read
- Float this Topic for Current User
- Bookmark
- Subscribe
- Printer Friendly Page
- Mark as New
- Bookmark
- Subscribe
- Mute
- Subscribe to RSS Feed
- Permalink
- Report Inappropriate Content
Applying Measure after Multiple Selection
Hello All,
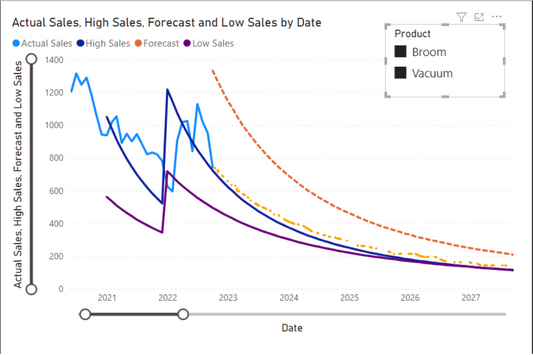
I have a measure that extrapolates a curve based off the ratio between the latest data point and another line. While it works fine for a single selection, it does not work as intended on multiple selections. I would like the measure to apply/calculate after the selection is done. Hopefully the below pics illustrate my point.
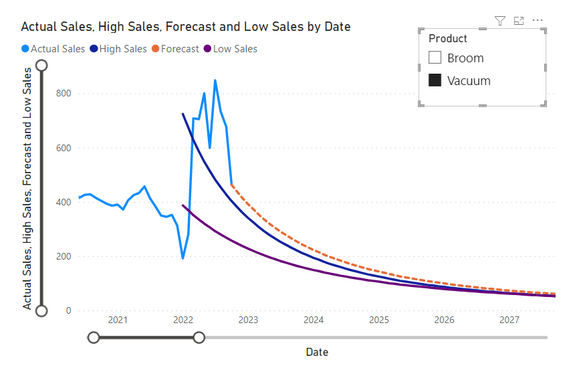
Case 1: Vacuum selected. 'Forecast' (orange) extrapolates from latest sales data in relation to the 'High Sales' line.
Latest Sale = Oct. 2022. Latest sale = 463. High Sales = 403. Ratio = 463/405 = 1.149.
Extrapolation keeps that ratio relative to 'High Sales' curve.
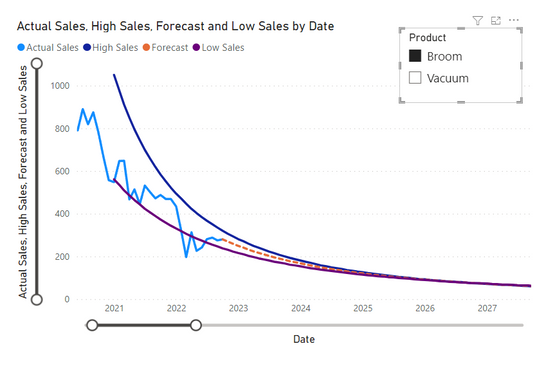
Case 2: Broom selected. 'Forecast' (orange) extrapolates from latest sales data in relation to the 'Low Sales' & 'High Sales' line.
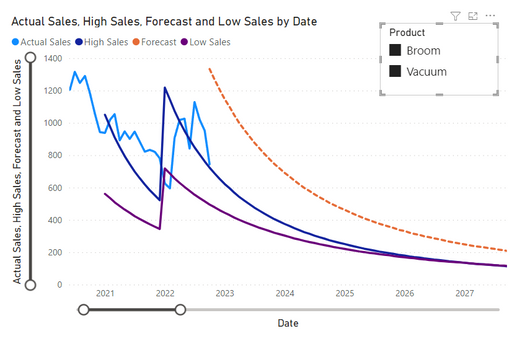
Case 3: Both Broom and Vacuum selected. 'Forecast' measure does not apply correctly to multiple selection and does not extrapolate from latest sales data.
I've linked the DAX measure and sample model below. Please let me know if you have issues accessing it.
Forecast =
// Finds latest sales date
VAR EvalDate =
    CALCULATE ( MAX ( SalesActual[Date] ), ALLSELECTED ( SalesActual ) )
VAR BoundaryDate =
    EOMONTH ( TODAY (), -2 ) + 1
VAR Date_ =
    // If latest sales date is older than 2 months,
    // it will default back to current month.
    IF (
        EvalDate < BoundaryDate,
        BoundaryDate,
        EvalDate
    )
VAR _id =
    CALCULATE ( MAXX ( ALLSELECTED ( SalesHighLow ), [Product] ) )
VAR SalesHistorical =
    CALCULATE (
        [Actual Sales],
        'Calendar'[Date] = Date_,
        SalesHighLow[Product] = _id
    )
VAR SalesHigh =
    CALCULATE (
        // Value of sales high curve @ Date_
        [High Sales],
        'Calendar'[Date] = Date_,
        SalesHighLow[Product] = _id
    )
VAR SalesLow =
    CALCULATE (
        // Value of sales low curve @ Date_
        [Low Sales],
        'Calendar'[Date] = Date_,
        SalesHighLow[Product] = _id
    )
VAR _cat =
    SWITCH (
        TRUE (),
        SalesHistorical <= SalesLow, 1,
        SalesHistorical <= SalesHigh, 2,
        SalesHistorical >= SalesHigh, 3
    )
VAR _result =
    IF (
        MIN ( 'Calendar'[Date] ) >= Date_,
        SWITCH (
            TRUE (),
            // TRUE used as first argument allows SWITCH to replace nested IFs  Cleaner to read.
            _cat = 1, CALCULATE ( [Low Sales] * DIVIDE ( SalesHistorical, SalesLow ) ),
            _cat = 2,
                CALCULATE (
                    ( [High Sales] * ( SalesHistorical - SalesLow ) + [Low Sales] * ( SalesHigh - SalesHistorical ) ) / ( SalesHigh - SalesLow )
                ),
            _cat = 3,
                CALCULATE ( [High Sales] * ( SalesHistorical / SalesHigh ) )
        )
    )
RETURN
    _result
Thank you!
Solved! Go to Solution.
- Mark as New
- Bookmark
- Subscribe
- Mute
- Subscribe to RSS Feed
- Permalink
- Report Inappropriate Content
Hi , @Palmtop
According to your description, you want to update the [Forcast] measure to meet the "Applying Measure after Multiple Selection". Right?
Here are the steps you can refer to :
I download you .pbix file and test in my side , you can create a measure to replace your [Forcast] measure:
Forecast2 =
// Finds latest sales date
VAR EvalDate =
    CALCULATE(
        MAX ( SalesActual[Date] ),
        ALLSELECTED ( SalesActual )
    )
var BoundaryDate = EOMONTH( TODAY(), -2 ) + 1
VAR Date_ =
    // If latest sales date is older than 2 months,
    // it will default back to current month.
    IF ( EvalDate < BoundaryDate,
        BoundaryDate,
        EvalDate
    )
var _id = VALUES('Product'[Product])
VAR SalesHistorical =
    CALCULATE(
        [Actual Sales],
        'Calendar'[Date] = Date_,
        SalesHighLow[Product] in _id
    )
VAR SalesHigh =
    CALCULATE (
        // Value of sales high curve @ Date_
        [High Sales],
        'Calendar'[Date] = Date_,
        SalesHighLow[Product] in _id
    )
VAR SalesLow =
    CALCULATE (
        // Value of sales low curve @ Date_
        [Low Sales],
        'Calendar'[Date] = Date_,
        SalesHighLow[Product] in _id
    )

var _cat = SWITCH(
                TRUE(),
                SalesHistorical <= SalesLow, 1,
                SalesHistorical <= SalesHigh, 2,
                SalesHistorical >= SalesHigh, 3
                )

var _result = IF ( MIN('Calendar'[Date]) >= Date_,
    SWITCH (
    TRUE(),   // TRUE used as first argument allows SWITCH to replace nested IFs  Cleaner to read.
    _cat = 1, CALCULATE( [Low Sales] * DIVIDE(SalesHistorical, SalesLow) ),
    _cat = 2, CALCULATE( ( [High Sales] * (SalesHistorical - SalesLow) + [Low Sales] * (SalesHigh - SalesHistorical) ) / (SalesHigh - SalesLow) ) ,
    _cat = 3, CALCULATE( [High Sales] * (SalesHistorical/ SalesHigh) )
    )
)

return
    _result
And then we will meet your need:
Thank you for your time and sharing, and thank you for your support and understanding of PowerBI!
Best Regards,
Aniya Zhang
If this post helps, then please consider Accept it as the solution to help the other members find it more quickly
- Mark as New
- Bookmark
- Subscribe
- Mute
- Subscribe to RSS Feed
- Permalink
- Report Inappropriate Content
Hi Aniya,
Success! Can confirm that worked for me. Thank you 🙂
For the sake of learning, I'm not understanding why if I replace
var _id = VALUES('Product'[Product])with
var _id = VALUES('SalesActual'[Product])
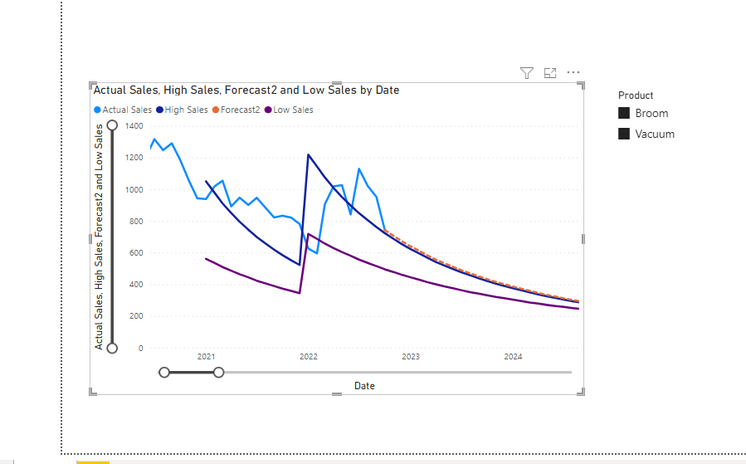
I end up with this chart,
The product column in all three tables consist of the same 2 distinct values 'Broom' and 'Vacuum' so shouldn't it give identical results regardless of which table I select?
Modelwise too I don't really see a difference.
Thanks again.
- Mark as New
- Bookmark
- Subscribe
- Mute
- Subscribe to RSS Feed
- Permalink
- Report Inappropriate Content
If you select many items, then... what is the latest sale date? Is it for broom or the other item? They can have different last sales dates, right? So then, which one do you want to use? This is not as straightforward as you might think. You have to ponder over what you want to do in such cases very thoroughly...
- Mark as New
- Bookmark
- Subscribe
- Mute
- Subscribe to RSS Feed
- Permalink
- Report Inappropriate Content
Hi daXtreme,
Thanks again for the help last time.
Regarding the question you pose, I'd like it so that when you select multiple items, you would sum the sales data to get a new dataset/curve (seen in Case 3) and the measure would treat it as a new independent dataset instead of one which is a sum of 2 others.
It would recalculate a ratio, latest sale date, latest sale #, and extrapolate it from there.
So, sum cases --> calculate measure instead of calculate measure for each case --> sum result.
Simpler answer would be whichever is the most recent.
So in an example case it would apply the measure to 'Total' taking 04/22 as the latest sale date.
| Date | Broom | Vacuum | Total |
| 01/22 | 10 | 0 | 10 |
| 02/22 | 15 | 5 | 20 |
| 03/22 | 0 | 7 | 7 |
| 04/22 | n/a | 7 | 7 |
Retaking the original cases, the desired result would look like the yellow line:
Please let me know if its still confusing. Thank you.
- Mark as New
- Bookmark
- Subscribe
- Mute
- Subscribe to RSS Feed
- Permalink
- Report Inappropriate Content
Can you please supply the data set?
Helpful resources

Power BI Monthly Update - November 2025
Check out the November 2025 Power BI update to learn about new features.

Fabric Data Days
Advance your Data & AI career with 50 days of live learning, contests, hands-on challenges, study groups & certifications and more!

| User | Count |
|---|---|
| 9 | |
| 7 | |
| 6 | |
| 6 | |
| 5 |
| User | Count |
|---|---|
| 24 | |
| 21 | |
| 18 | |
| 14 | |
| 14 |
