This time we’re going bigger than ever. Fabric, Power BI, SQL, AI and more. We're covering it all. You won't want to miss it.
Learn moreLevel up your Power BI skills this month - build one visual each week and tell better stories with data! Get started
Hi All,
I have three tables 1. Date table 2.Actual table 3.Forecast table.
Date table connected to rest two tables.
Slice i am using from Date table.
Now, Need Actuals and Forcast in smae chart where few bars are Actuals, few bars are Forecast. like below
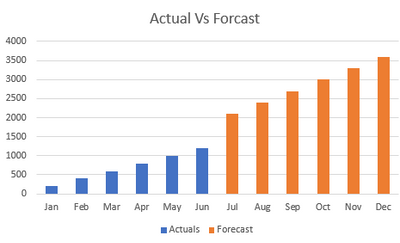
1. User asking If I select June then Jan to June is Actuals and July to Dec Forecast need.
2. if he select Sept then Jan to Sept Actuals and Oct to dec Forecast need.
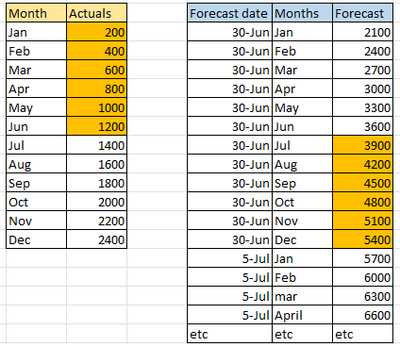
3. Forecast table have few dates but each date there is 12 motnhs forecast values associated.
bit of complex here is :-
1. if user select June then Jan to June Actual at the same time June has to Pick up nearest forecast date and get next months values.(as i said Each forecast date have 12 months associated so greate than of June month values need from forecast table)
2. as per below. If user select June then nearest forcast date 30-june so Greater than of June Forcast all months values requred in same chart.
Thanks in Advance
Please provide sample data that covers your issue or question completely, in a usable format (not as a screenshot).
https://community.fabric.microsoft.com/t5/Community-Blog/How-to-provide-sample-data-in-the-Power-BI-...
Please show the expected outcome based on the sample data you provided.
https://community.fabric.microsoft.com/t5/Desktop/How-to-Get-Your-Question-Answered-Quickly/m-p/1447...
Check out the April 2026 Power BI update to learn about new features.
Sign up to receive a private message when registration opens and key events begin.
If you have recently started exploring Fabric, we'd love to hear how it's going. Your feedback can help with product improvements.
| User | Count |
|---|---|
| 5 | |
| 4 | |
| 3 | |
| 3 | |
| 3 |
| User | Count |
|---|---|
| 9 | |
| 8 | |
| 7 | |
| 6 | |
| 6 |