
Get certified for free when you join Fabric Data Days 2026 and dive into Fabric, Power BI, SQL, AI, and other essential data skills.
Join nowJuly 7 - July 17 | Round 2 of the Power BI Dataviz World Championships. Don't miss your chance! Learn more
I would like to show 3 data group in 3 Card in same 1 page
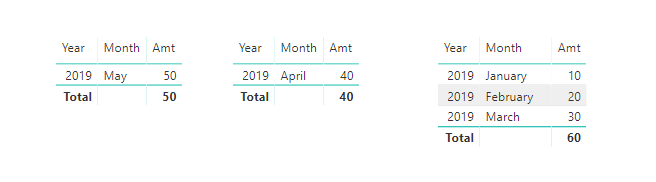
Data want to show is Present Month (05) Amt=50, Month April (04) Amt=40 and Month accumulate Jan to March = 10 +20 +30 = 60
How to show 3 data in same one page report:
Year Month Amt
2019 01 10
2019 02 20
2019 03 30
2019 04 40
2019 05 50
1.Month May show 50 ,
2.April show 40 ,
3.Accum Jan-Mar Show 60
Thank you for all answer.
Hello,
I suppose you can use three Table visuals with different filters applied in the "Fields" panel to reach this effect, like in picture below.
If you want to dynamically change filtration, you can create 3 copies of the same dataset for instance and apply Timeline Slicer for each case.
Kind Regards,
Evgenii Elkin,
Software Engineer
Microsoft Power BI Custom Visuals
[email protected]
Join us in Barcelona for FabCon and SQLCon, the Fabric, Power BI, SQL, and AI community event. Save €200 with code FABCMTY200.
Join Fabric Data Days 2026: 60 days of free live/on-demand sessions, challenges, study groups, and certification opportunities.
| User | Count |
|---|---|
| 3 | |
| 3 | |
| 1 | |
| 1 | |
| 1 |