FabCon is coming to Atlanta
Join us at FabCon Atlanta from March 16 - 20, 2026, for the ultimate Fabric, Power BI, AI and SQL community-led event. Save $200 with code FABCOMM.
Register now!View all the Fabric Data Days sessions on demand. View schedule
- Microsoft Fabric Community
- Fabric community blogs
- Power BI Community Blog
- Working with Power BI Gateway logs
- Subscribe to RSS Feed
- Mark as New
- Mark as Read
- Bookmark
- Subscribe
- Printer Friendly Page
- Report Inappropriate Content
- Subscribe to RSS Feed
- Mark as New
- Mark as Read
- Bookmark
- Subscribe
- Printer Friendly Page
- Report Inappropriate Content
Power BI gateways serve in an important role - they bridge the data gap between the Azure service that drives Power BI online offerings like browser based reports and dashboards, or user access to XMLA endpoints for example through "Analyze in Excel".
Without gateways the Azure service would not know how to talk to your on-premise data sources (like SQL server in your company network). Gateways receive requests from the Azure service, process them, and return the results to the service.
If you have a personal gateway, or a single instance of an Enterprise gateway then live dangerously - your personal gateway may be installed on a PC that is not always on, or your single instance Enterprise gateway might fall offline for a variety of reasons.
If you are concerned about business continuity (and you should be) then you want a gateway cluster with multiple gateway instances (ideally in different geographical locations) combined together into a gateway cluster. That way if one of the instances falls over, the other instances can continue to serve the data requests without much impact.
Setting a cluster up is one thing, measuring its efficiency is something else entirely. How do you know if a gateway is part of your slow refresh problem or not? Can the gateway handle all the requests for refresh during a regular week? If so, can it do so barely, or with plenty or capacity to spare?
One way to look at this is to examine the gateway logs. In the default configuration these logs are collected automatically both for general information and for errors. The info logs tend to be rather verbose so the gateway only keeps them around for a day or so. Errors are (hopefully) less frequent and you may see two weeks or more of logs.
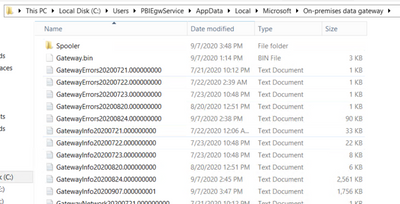
Logs are stored in the "appdata" folder of the account running the gateway service.
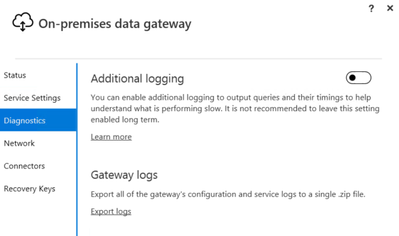
You can also enable advanced logging (you need to restart the gateway service for that) for even more verbose logging and even shorter retention periods. You only want to do that for short periods of time when asked by Microsoft to provide gateway logs as part of the investigation of a ticket you raised. Clicking on the "Export Logs" link will basically pack up all the text files into a ZIP archive.
Giving the log data to Microsoft is not optimal though. They are investigating the issues with one of your dataset refreshes but you may have hundreds of other refreshes going on that are unrelated (and potentially contain senistive information). Collecting the gateway logs manually also gets old very quickly if you have more than just one or two instances (as you should, for business continuity).
What if we could examine these log files manually? Can't be that hard, right. These are just text files after all.
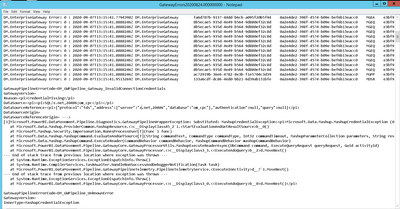
This is where it gets ugly, and quick. Log files are more like a bunch of stream of consciousness flow of random thoughts scribbled onto a napkin on a wet table in a stiff breeze.
Well, maybe not exactly, but as you can see these log files certainly lack one thing - structure. And they have a lot of dead weight, rows and rows of text that seemingly have no information.
There is no documentation (that I know of) on the structure of the log files. From my observations they can have as few as a single column and as much as eight columns of data, with a lot of these columns filled with seemingly meaningless identifiers for processes and subprocesses.
There are some identifiable pieces - timestamps, message types, and the occasional clear text of an error.
The best I could come up with is a Power Query franken-script to try and tame the data and only let the information through. I am pretty sure that I am misinterpreting some of the data, and missing other important items.
Here is the script ("GetLog") to process an individual text file. Note that I chose to add an index to get some idea of the sequence of events as often there are many events with the exact same timestamp. Also note that the actual useful information can either be in column 1 or column 8 so I add an "action" column that pulls the data accordingly.
(Content) => let
        Source = Csv.Document(Content,[Delimiter="#(tab)", Columns=8, Encoding=65001, QuoteStyle=QuoteStyle.None]),
        #"Added Index" = Table.AddIndexColumn(Source, "Index", 0, 1, Int64.Type),
        #"Added Conditional Column" = Table.AddColumn(#"Added Index", "Action", each if [Column8] = "" then [Column1] else [Column8]),
        #"Added Conditional Column1" = Table.AddColumn(#"Added Conditional Column", "Timestamp", each if Text.StartsWith([Column1], "DM.") then Text.Middle([Column1],Text.PositionOf([Column1],":")+6,28) else null),
        #"Removed Columns" = Table.RemoveColumns(#"Added Conditional Column1",{"Column1", "Column8"}),
        #"Replaced Value" = Table.ReplaceValue(#"Removed Columns","",null,Replacer.ReplaceValue,{"Column2", "Column3", "Column4", "Column5", "Column6", "Column7", "Action", "Timestamp"}),
        #"Filled Down" = Table.FillDown(#"Replaced Value",{"Column2", "Column3", "Column4", "Column5", "Column6", "Column7", "Action", "Timestamp"})
    in
        #"Filled Down"
Then you can choose to treat Info logs and Error logs differently (although they have the same structure) and focus on certain action types or content.
Here is an exmple of how to read all the Info files from a gateway cluster member ("GetInfo"):
(Machine) => let
    Source = Folder.Files("\\" & Machine & "\c$\Users\PBIEgwService\AppData\Local\Microsoft\On-premises data gateway"),
    #"Filtered Rows" = Table.SelectRows(Source, each Text.StartsWith([Name], "GatewayInfo")),
    #"Invoke Custom Function1" = Table.AddColumn(#"Filtered Rows", "Transform File", each GetLog([Content])),
    #"Expanded Transform File" = Table.ExpandTableColumn(#"Invoke Custom Function1", "Transform File", {"Column2", "Column3", "Column4", "Column5", "Column6", "Column7", "Index", "Action", "Timestamp"}, {"Column2", "Column3", "Column4", "Column5", "Column6", "Column7", "Index", "Action", "Timestamp"}),
    #"Removed Other Columns" = Table.SelectColumns(#"Expanded Transform File",{"Column2", "Column3", "Column4", "Column5", "Column6", "Column7", "Index", "Action", "Timestamp"})
in
    #"Removed Other Columns"
Now all that remains is to provide a list of machines (your gateway cluster members) and to run the log collection across the entire list.
let
    Source = Gateways,
    #"Filtered Rows" = Table.SelectRows(Source, each [Active]=true),
    #"Invoked Custom Function" = Table.AddColumn(#"Filtered Rows", "GetInfo", each GetInfo([Gateway])),
    #"Expanded GetInfo" = Table.ExpandTableColumn(#"Invoked Custom Function", "GetInfo", {"Column2", "Column3", "Column4", "Column5", "Column6", "Column7", "Index", "Action", "Timestamp"}, {"Column2", "Column3", "Column4", "GatewaySessionID", "ClientPipelineID", "Column7", "Index", "Action", "Timestamp"}),
    #"Changed Type" = Table.TransformColumnTypes(#"Expanded GetInfo",{{"Timestamp", type datetimezone}, {"Index", Int64.Type}})
in
    #"Changed Type"
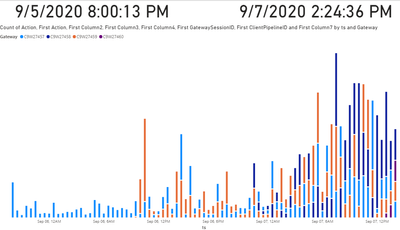
Now we can run reports about gateway cluster utilization over time, and we can validate that all gateway cluster members do their part in processing the service requests.
Here is an example of the on-ramp of requests against the four cluster members of one gateway on Monday. Note that the primary (anchor) cluster member failed to restart on Saturday. The other three cluster member continued on, and on Monday I swapped in a new primary member.
Gateway error logs help to identify connections where either the credentials have expired, or where the data source is offline.
I have found that gateways distribute data source refresh requests over multiple cluster members, even for the same dataset. That's actually pretty impressive. After lots of searching I also finally found how to connect the gateway logs back to our tenant audit logs - the dataset Id is included in the "objectId" rows of the log files. Adding a calculated column
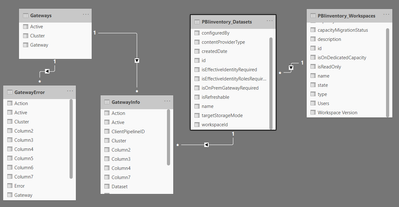
Now I can directly identify the developer I need to work with to correct a connection issue, or any excessive refresh requests that consume all the gateway resources.
None of the above is simple. I wish that in the future Microsoft would provide more information on the structure of the gateway logs, more controls on what to log, and ideally some real time gateway performance monitoring tools that would make the described process obsolete.
You must be a registered user to add a comment. If you've already registered, sign in. Otherwise, register and sign in.
- Data Governance in Microsoft Fabric: Trust, Visibi...
- The "Hidden" Gems That Will Save You Hours
- Importance of Power BI Governance Framework
- When Semi-Additive Metrics Fall Short: Why You Nee...
- QuickViz Challenge | Spotlight 🔦
- 🏆 Announcing the finalists of the Fabric Data Day...
- 🏆 Announcing the winner of the Fabric Data Days N...
- 🏆 Announcing the winners of the Fabric Data Days ...
- What Happens Actually When You Change Cross Filter...
- SQL's APPLY Clause in PowerBI DAX ?
-
burakkaragoz
 on:
The "Hidden" Gems That Will Save You Hours
- Hemanth_Elluri2 on: Importance of Power BI Governance Framework
-
 slindsay
on:
QuickViz Challenge | Spotlight 🔦
-
Abhilash_P
 on:
🏆 Announcing the finalists of the Fabric Data Day...
- lahirucw on: 🏆 Announcing the winner of the Fabric Data Days N...
- RishabhVerma on: 🏆 Announcing the winners of the Fabric Data Days ...
-
EsraaKamal
 on:
What Happens Actually When You Change Cross Filter...
- Prosundas on: SQL's APPLY Clause in PowerBI DAX ?
-
Murtaza_Ghafoor
 on:
Power BI TMDL View: Tasks You Can Finally Do Witho...
-
 slindsay
on:
QuickViz Challenge | Matrix Magic 🪄
-
How To
738 -
Tips & Tricks
719 -
Events
183 -
Support insights
121 -
Opinion
92 -
DAX
66 -
Power BI
65 -
Power Query
62 -
Power BI Dev Camp
45 -
Power BI Desktop
40 -
Roundup
39 -
Dataflow
31 -
Featured User Group Leader
27 -
Power BI Embedded
20 -
Time Intelligence
19 -
Data Protection
18 -
Tips&Tricks
18 -
PowerBI REST API
12 -
finance
8 -
Power BI Service
8 -
Power Query Tips & Tricks
8 -
Direct Query
7 -
Power BI REST API
6 -
Auto ML
6 -
financial reporting
6 -
Data Analysis
6 -
Power Automate
6 -
Data Visualization
6 -
Python
6 -
Tips and Tricks
6 -
Income Statement
5 -
Dax studio
5 -
powerbi
5 -
service
5 -
Power BI PowerShell
5 -
Machine Learning
5 -
Paginated Reports
4 -
External tool
4 -
Power BI Goals
4 -
Desktop
4 -
PowerShell
4 -
Bookmarks
4 -
Line chart
4 -
Group By
4 -
community
4 -
RLS
4 -
M language
4 -
Life Sciences
4 -
Administration
3 -
M code
3 -
Visuals
3 -
SQL Server 2017 Express Edition
3 -
R script
3 -
Aggregation
3 -
Webinar
3 -
calendar
3 -
Gateways
3 -
R
3 -
M Query
3 -
CALCULATE
3 -
R visual
3 -
Reports
3 -
PowerApps
3 -
Data Science
3 -
Azure
3 -
Data model
3 -
Conditional Formatting
3 -
Visualisation
3 -
measure
2 -
Microsoft-flow
2 -
Paginated Report Builder
2 -
Working with Non Standatd Periods
2 -
powerbi.tips
2 -
Custom function
2 -
Reverse
2 -
PUG
2 -
Custom Measures
2 -
Filtering
2 -
Row and column conversion
2 -
Python script
2 -
Nulls
2 -
DVW Analytics
2 -
parameter
2 -
Industrial App Store
2 -
Week
2 -
Date duration
2 -
Formatting
2 -
Weekday Calendar
2 -
Support insights.
2 -
construct list
2 -
slicers
2 -
SAP
2 -
Power Platform
2 -
Workday
2 -
external tools
2 -
index
2 -
RANKX
2 -
Date
2 -
PBI Desktop
2 -
Date Dimension
2 -
Integer
2 -
Visualization
2 -
Power BI Challenge
2 -
Query Parameter
2 -
SharePoint
2 -
Power BI Installation and Updates
2 -
How Things Work
2 -
Tabular Editor
2 -
rank
2 -
ladataweb
2 -
Troubleshooting
2 -
Date DIFF
2 -
Transform data
2 -
Healthcare
2 -
Incremental Refresh
2 -
Number Ranges
2 -
Query Plans
2 -
Power BI & Power Apps
2 -
Random numbers
2 -
Day of the Week
2 -
Custom visual
2 -
VLOOKUP
2 -
pivot
2 -
calculated column
2 -
M
2 -
hierarchies
2 -
Power BI Anniversary
2 -
Language M
2 -
inexact
2 -
Date Comparison
2 -
Power BI Premium Per user
2 -
Forecasting
2 -
REST API
2 -
Editor
2 -
Split
2 -
help
1 -
group
1 -
Scorecard
1 -
Json
1 -
Tops
1 -
financial reporting hierarchies RLS
1 -
Featured Data Stories
1 -
MQTT
1 -
Custom Periods
1 -
Partial group
1 -
Reduce Size
1 -
FBL3N
1 -
Wednesday
1 -
Q&A
1 -
Quick Tips
1 -
data
1 -
PBIRS
1 -
Usage Metrics in Power BI
1 -
Multivalued column
1 -
Pipeline
1 -
Path
1 -
Yokogawa
1 -
Dynamic calculation
1 -
Data Wrangling
1 -
native folded query
1 -
transform table
1 -
UX
1 -
Cell content
1 -
General Ledger
1 -
Thursday
1 -
update
1 -
Table
1 -
Natural Query Language
1 -
Infographic
1 -
automation
1 -
Prediction
1 -
newworkspacepowerbi
1 -
Performance KPIs
1 -
HR Analytics
1 -
keepfilters
1 -
Connect Data
1 -
Financial Year
1 -
Schneider
1 -
dynamically delete records
1 -
Copy Measures
1 -
Friday
1 -
Training
1 -
Event
1 -
Custom Visuals
1 -
Free vs Pro
1 -
Format
1 -
Active Employee
1 -
Custom Date Range on Date Slicer
1 -
refresh error
1 -
PAS
1 -
certain duration
1 -
DA-100
1 -
bulk renaming of columns
1 -
Single Date Picker
1 -
Monday
1 -
PCS
1 -
Saturday
1 -
Slicer
1 -
Visual
1 -
forecast
1 -
Regression
1 -
CICD
1 -
Current Employees
1 -
date hierarchy
1 -
relationship
1 -
SIEMENS
1 -
Multiple Currency
1 -
Power BI Premium
1 -
On-premises data gateway
1 -
Binary
1 -
Power BI Connector for SAP
1 -
Sunday
1 -
Workspace
1 -
Announcement
1 -
Features
1 -
domain
1 -
pbiviz
1 -
sport statistics
1 -
Intelligent Plant
1 -
Circular dependency
1 -
GE
1 -
Exchange rate
1 -
Dendrogram
1 -
range of values
1 -
activity log
1 -
Decimal
1 -
Charticulator Challenge
1 -
Field parameters
1 -
deployment
1 -
ssrs traffic light indicators
1 -
SQL
1 -
trick
1 -
Scripts
1 -
Color Map
1 -
Industrial
1 -
Weekday
1 -
Working Date
1 -
Space Issue
1 -
Emerson
1 -
Date Table
1 -
Cluster Analysis
1 -
Stacked Area Chart
1 -
union tables
1 -
Number
1 -
Start of Week
1 -
Tips& Tricks
1 -
Theme Colours
1 -
Text
1 -
Flow
1 -
Publish to Web
1 -
Extract
1 -
Topper Color On Map
1 -
Historians
1 -
context transition
1 -
Custom textbox
1 -
OPC
1 -
Zabbix
1 -
Label: DAX
1 -
Business Analysis
1 -
Supporting Insight
1 -
rank value
1 -
Synapse
1 -
End of Week
1 -
Tips&Trick
1 -
Excel
1 -
Showcase
1 -
custom connector
1 -
Waterfall Chart
1 -
Power BI On-Premise Data Gateway
1 -
patch
1 -
Top Category Color
1 -
A&E data
1 -
Previous Order
1 -
Substring
1 -
Wonderware
1 -
Power M
1 -
Format DAX
1 -
Custom functions
1 -
accumulative
1 -
DAX&Power Query
1 -
Premium Per User
1 -
GENERATESERIES
1 -
Report Server
1 -
Audit Logs
1 -
analytics pane
1 -
step by step
1 -
Top Brand Color on Map
1 -
Tutorial
1 -
Previous Date
1 -
XMLA End point
1 -
color reference
1 -
Date Time
1 -
Marker
1 -
Lineage
1 -
CSV file
1 -
conditional accumulative
1 -
Matrix Subtotal
1 -
Check
1 -
null value
1 -
Show and Tell
1 -
Cumulative Totals
1 -
Report Theme
1 -
Bookmarking
1 -
oracle
1 -
mahak
1 -
pandas
1 -
Networkdays
1 -
Button
1 -
Dataset list
1 -
Keyboard Shortcuts
1 -
Fill Function
1 -
LOOKUPVALUE()
1 -
Tips &Tricks
1 -
Plotly package
1 -
Sameperiodlastyear
1 -
Office Theme
1 -
matrix
1 -
bar chart
1 -
Measures
1 -
powerbi argentina
1 -
Canvas Apps
1 -
total
1 -
Filter context
1 -
Difference between two dates
1 -
get data
1 -
OSI
1 -
Query format convert
1 -
ETL
1 -
Json files
1 -
Merge Rows
1 -
CONCATENATEX()
1 -
take over Datasets;
1 -
Networkdays.Intl
1 -
refresh M language Python script Support Insights
1 -
Tutorial Requests
1 -
Governance
1 -
Fun
1 -
Power BI gateway
1 -
gateway
1 -
Elementary
1 -
Custom filters
1 -
Vertipaq Analyzer
1 -
powerbi cordoba
1 -
Model Driven Apps
1 -
REMOVEFILTERS
1 -
XMLA endpoint
1 -
translations
1 -
OSI pi
1 -
Parquet
1 -
Change rows to columns
1 -
remove spaces
1 -
Get row and column totals
1 -
Retail
1 -
Power BI Report Server
1 -
School
1 -
Cost-Benefit Analysis
1 -
DIisconnected Tables
1 -
Sandbox
1 -
Honeywell
1 -
Combine queries
1 -
X axis at different granularity
1 -
ADLS
1 -
Primary Key
1 -
Microsoft 365 usage analytics data
1 -
Randomly filter
1 -
Week of the Day
1 -
Azure AAD
1 -
query
1 -
Dynamic Visuals
1 -
KPI
1 -
Intro
1 -
Icons
1 -
ISV
1 -
Ties
1 -
unpivot
1 -
Practice Model
1 -
Continuous streak
1 -
ProcessVue
1 -
Create function
1 -
Table.Schema
1 -
Acknowledging
1 -
Postman
1 -
Text.ContainsAny
1 -
Power BI Show
1 -
Get latest sign-in data for each user
1 -
Power Pivot
1 -
API
1 -
Kingsley
1 -
Merge
1 -
variable
1 -
Issues
1 -
function
1 -
stacked column chart
1 -
ho
1 -
ABB
1 -
KNN algorithm
1 -
List.Zip
1 -
optimization
1 -
Artificial Intelligence
1 -
Map Visual
1 -
Text.ContainsAll
1 -
Tuesday
1
- 12-14-2025 - 12-15-2025
- 12-07-2025 - 12-13-2025
- 11-30-2025 - 12-06-2025
- 11-23-2025 - 11-29-2025
- 11-16-2025 - 11-22-2025
- 11-09-2025 - 11-15-2025
- 11-02-2025 - 11-08-2025
- 10-26-2025 - 11-01-2025
- 10-19-2025 - 10-25-2025
- 10-12-2025 - 10-18-2025
- 10-05-2025 - 10-11-2025
- 09-28-2025 - 10-04-2025
- 09-21-2025 - 09-27-2025
- 09-14-2025 - 09-20-2025
- View Complete Archives
