Forum Discussion

Count Weekly Created / Resolved tickets
Dear All,
I am new to PowerBI and I have an issue creating the weekly report of the created/resolved tickets.
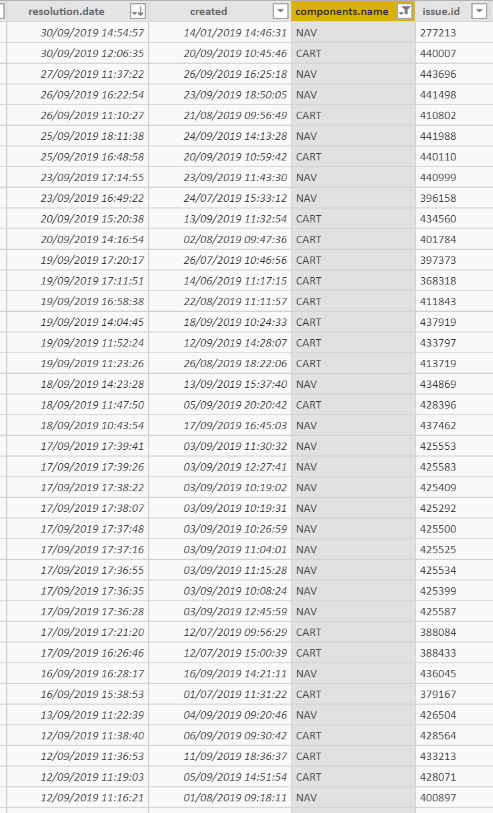
The data sample is as below, the requirement is to have the total created tickets vs total resolved tickets weekly and monthly, and it can be filter by certain field (here is the component, but it can be the issue type, or other field values).
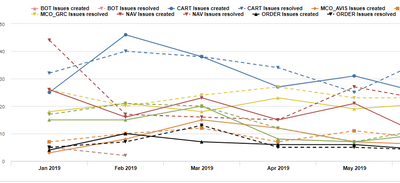
The report that I expect would be something like below in weekly basis :

Could you please advise ?
Many thanks in advance.
Trang
hi, Anonymous
Sorry for my carelessness about your screenshot.
your report has the same logic with my simple sample report,
for your case, you need to add two date columns for [created] and [resolution.date].
Since they are datetime, and have different time for each day, but [date] column in date table only has 12:00:00 AM for each day, therefore, it leads to the wrong result.
So please adjust it as below:
Step1:
Create two date column for [created] and [resolution.date]
new resolution.date = DATE(YEAR('Table'[resolution.date]),MONTH('Table'[resolution.date]),DAY('Table'[resolution.date]))new created = DATE(YEAR('Table'[created]),MONTH('Table'[created]),DAY('Table'[created]))Step2:
Then use these two new columns to create the relationship
Step3:
Adjust the formula as below:
total Resolved = CALCULATE(COUNTA('Table'[ID]),USERELATIONSHIP('Date'[Date],'Table'[new resolution.date]))here is new sample pbix file, please try it.
and if you still have problem, please share a simple sample pbix file and your expected output.
You can upload it to OneDrive and post the link here. Do mask sensitive data before uploading.
Best Regards,
Lin
7 Replies
 v-lili6-msft
Community Support
hi, Anonymous
For your case, you could try this way as below:
Step1:
Create a new date table and create two relationships with this fact table by [created] and [resolution.date].
Note: One is active and another is inactive.
Step2:
Create two total measure, use USERELATIONSHIP Function for the inactive relationship.
total Create = CALCULATE(COUNTA('Table'[ID]))total Resolved = CALCULATE(COUNTA('Table'[ID]),USERELATIONSHIP('Date'[Date],'Table'[resolution.date]))Result:
here is simple example:
For your case, just drag date dim columns and these two measure into line chart .
here is sample pbix file, please try it.
Best Regards,
Lin
- AnonymousNot applicable
Hi Lin,
Thanks for your advise.
The first thing is that I can't have a sum of tickets created / resolved weekly. As I understand well, your report is daily basis.
Secondly, I couldn't reproduce the same report . I have the same number of resolved/closed tickets, and the date column is empty. Please see below. Did it miss somethings ?
Trang
- v-lili6-msft
hi, Anonymous
Sorry for my carelessness about your screenshot.
your report has the same logic with my simple sample report,
for your case, you need to add two date columns for [created] and [resolution.date].
Since they are datetime, and have different time for each day, but [date] column in date table only has 12:00:00 AM for each day, therefore, it leads to the wrong result.
So please adjust it as below:
Step1:
Create two date column for [created] and [resolution.date]
new resolution.date = DATE(YEAR('Table'[resolution.date]),MONTH('Table'[resolution.date]),DAY('Table'[resolution.date]))new created = DATE(YEAR('Table'[created]),MONTH('Table'[created]),DAY('Table'[created]))Step2:
Then use these two new columns to create the relationship
Step3:
Adjust the formula as below:
total Resolved = CALCULATE(COUNTA('Table'[ID]),USERELATIONSHIP('Date'[Date],'Table'[new resolution.date]))here is new sample pbix file, please try it.
and if you still have problem, please share a simple sample pbix file and your expected output.
You can upload it to OneDrive and post the link here. Do mask sensitive data before uploading.
Best Regards,
Lin
- Ashish_Mathur
Super User
Hi,
Share the link from where i can download your PBI file.
