FabCon is coming to Atlanta
Join us at FabCon Atlanta from March 16 - 20, 2026, for the ultimate Fabric, Power BI, AI and SQL community-led event. Save $200 with code FABCOMM.
Register now!Get Fabric Certified for FREE during Fabric Data Days. Don't miss your chance! Request now
- Microsoft Fabric Community
- Fabric community blogs
- Power BI Community Blog
- How to filter multivalued column in Power BI
- Subscribe to RSS Feed
- Mark as New
- Mark as Read
- Bookmark
- Subscribe
- Printer Friendly Page
- Report Inappropriate Content
- Subscribe to RSS Feed
- Mark as New
- Mark as Read
- Bookmark
- Subscribe
- Printer Friendly Page
- Report Inappropriate Content
Recently someone asked me what is the best way to filter on multi-valued columns in Power BI. The question was in the context of Tags property of the Work Items - Today table in the Visual Studio Team Services [1]. Although the original question was very specific, the solution I came up with can be generalized to multivalued columns in any data model.
What is a multivalued column?
Multivalued column is a database design pattern where instead of normalizing and splitting data across multiple tables you keep multiple values in a single table. You can see it typically in the data warehouses where normalization would lead to a too granular fact tables. One of the best examples is the Categories column in the Product table where want to allow users to select multiple values, but you don't want to create a separate Categories table.
In the context of Visual Studio Team Services there is one table where this pattern was applied - Work Items - Today. It contains Tags column which is a "; " delimited list of tags like in the example below.
| Work Item Id | Title | Tags |
| 1 | Add column A to table B | database; milestone1 |
| 2 | Create migration script | database |
| 3 | Improve performance of slow queries | performance; database |
| ... | ... | ... |
Problem statement
Given table with a multivalued column prepare data model that will allow users to easily filter on distinct values. For example, we can start with the table below, which has multivalued Tags column.
let
    Source = #table(
        {"Work Item Id", "Title", "Tags"},
        {
            { "1", "Add column A to table B", "database; milestone1" },
            { "2", "Create migration script", "database" },
            { "3", "Improve performance of slow queries", "performance; database" }
        })
in
    Source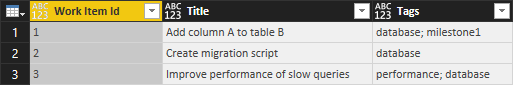
If we simply selected Tags for the slicer it would produce the following result. Instead of values users could only select combinations that appear in the dataset. That's not what we want.

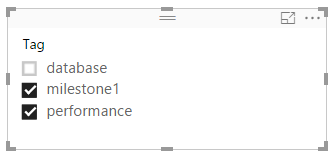
A much better design is to extract distinct values from the Tags column so that we can build the following slicer.
Solution
The solution I would like to show you is based on the post by SQLJason where he talks about handling delimited rows [2]. I modernized and improved it a little to cover columns of arbitrary length and to avoid contaminating model with auxiliary tables. The idea stays the same and can be broken down into the following steps.
- Create temporary index table.
- Apply CROSSJOIN operation and convert source table from wide to long format.
- Define relationships.
In my previous post "Creating index table in DAX" I explained how to create index table for a given N. Here, N should be selected as the max number of elements in the multivalued column.
MaxLength =
VAR Separator = "; "
RETURN
    MAXX (
        'Work Items - Today',
        1 + LEN ( [Tags] )
            - LEN ( SUBSTITUTE ( [Tags], Separator, "" ) )
    )
Now we can use this DAX expression and create Indexes table.
Indexes =
VAR Separator = "; "
RETURN
    FILTER (
        SUMMARIZE (
            ADDCOLUMNS (
                CALENDAR (
                    DATE ( 2000, 1, 1 ),
                    DATE ( 2000
                        + MAXX (
                            'Work Items - Today',
                            1 + LEN ( [Tags] )
                                - LEN ( SUBSTITUTE ( [Tags], Separator, "" ) )
                        ), 1, 1 )
                ),
                "Index", YEAR ( [Date] ) - 2000
            ),
            [Index]
        ),
        [Index] > 0
)| Index |
| 1 |
| 2 |
| 3 |
We do not need to store this table in our model. Instead, we can simply save it in the DAX variable and reuse later.
The final expression consists of the following operations:
- Save separator in the variable.
- Create index table.
- Add TagsCount to the Work Item - Today table to keep track of the index range.
- Apply CROSSJOIN with Indexes table.
- Filter out indexes that are outside of the range.
- Use PATHITEM to extract single value from the multivalued field by index and save it in Tag column.
- Summarize to reduce set of columns in the output table.
Tags =
VAR Separator = "; "
VAR Indexes =
    FILTER (
        SUMMARIZE (
            ADDCOLUMNS (
                CALENDAR (
                    DATE ( 2000, 1, 1 ),
                    DATE ( 2000
                        + MAXX (
                            'Work Items - Today',
                            1 + LEN ( [Tags] )
                                - LEN ( SUBSTITUTE ( [Tags], Separator, "" ) )
                        ), 1, 1 )
                ),
                "Index", YEAR ( [Date] ) - 2000
            ),
            [Index]
        ),
        [Index] > 0
    )
RETURN
    SUMMARIZE (
        ADDCOLUMNS (
            FILTER (
                CROSSJOIN (
                    ADDCOLUMNS (
                        'Work Items - Today',
                        "TagsCount", 1
                            + ( LEN ( [Tags] ) - LEN ( SUBSTITUTE ( [Tags], Separator, "" ) ) )
                                / LEN ( Separator )
                    ),
                    Indexes
                ),
                [Index] <= [TagsCount]
            ),
            "Tag", PATHITEM ( SUBSTITUTE ( [Tags], Separator, "|" ), [Index] )
        ),
        [Work Item Id],
        [Tag]
    )
It will produce the following result. This table captures relationship between work items and tags.
| Work Item Id | Tag |
| 1 | database |
| 2 | database |
| 3 | performance |
| 1 | milestone1 |
| 3 | database |
Now, we need to define relationships and specify cross filtering direction. First, task is easy because most likely Power BI will automatically detect the relationship like in the example below.
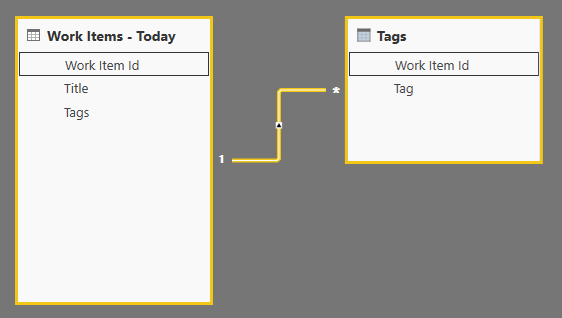
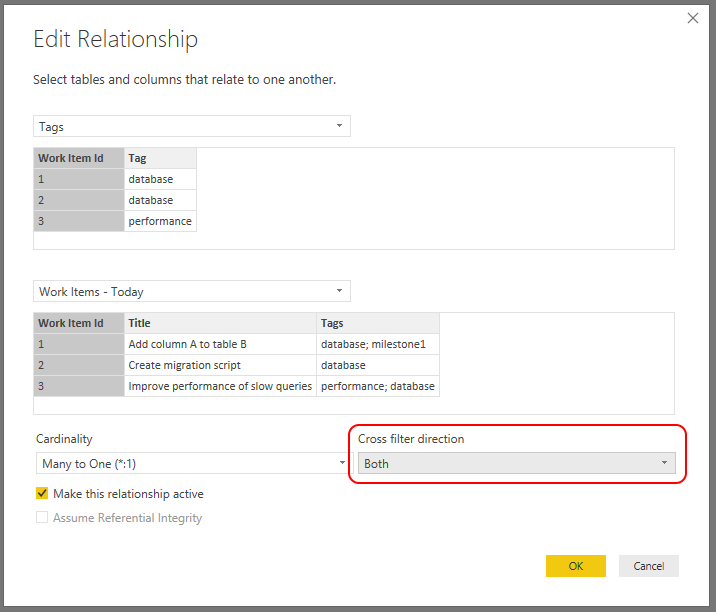
The automatic relationship is a standard one-to-many relationship, which means that it will allow us to filter Tags based on Work Item - Today selection. That is exactly opposite of what we need. Double-click on the relationship to open the advanced editor and under "Cross filter direction" select "Both".
Finally, create a new slicer with Tag field from the newly created Tags table to get the best filtering experience! You can also try out amazing Smart Filter custom visual, which fits perfectly for this scenario.
References:
- Team Services & TFS - Available data tables in the Power BI Data Connector for Team Services
- Split a Delimited Row into Multiple Rows using DAX Queries
- It is not overengineering - Creating index table in DAX
- Custom visuals for Power BI - Smart Filter by OKViz
- SQLBI - Best Practices Using SUMMARIZE and ADDCOLUMNS
- Power BI Documentation - Calculated tables in Power BI Desktop
You must be a registered user to add a comment. If you've already registered, sign in. Otherwise, register and sign in.
- What Happens Actually When You Change Cross Filter...
- SQL's APPLY Clause in PowerBI DAX ?
- Power BI TMDL View: Tasks You Can Finally Do Witho...
- QuickViz Challenge | Matrix Magic 🪄
- Fabric Data Days | Digital Flair!
- Meet the Judges | Dataviz Contest for Pros | Fabri...
- QuickViz Challenge | Time traveler
- From Chaos to Clarity: Designing a Scalable Data M...
- Exploring Simple Scenario Analysis in Power BI: In...
- How to Create Reusable Power BI Sample Data Using ...
-
vivmueller
 on:
What Happens Actually When You Change Cross Filter...
on:
What Happens Actually When You Change Cross Filter...
-
 tharunkumarRTK
on:
Power BI TMDL View: Tasks You Can Finally Do Witho...
tharunkumarRTK
on:
Power BI TMDL View: Tasks You Can Finally Do Witho...
-
 slindsay
on:
QuickViz Challenge | Matrix Magic 🪄
slindsay
on:
QuickViz Challenge | Matrix Magic 🪄
- Yaminijkothala on: Fabric Data Days | Digital Flair!
- maheshshinde on: QuickViz Challenge | Time traveler
-
ajaybabuinturi
 on:
From Chaos to Clarity: Designing a Scalable Data M...
on:
From Chaos to Clarity: Designing a Scalable Data M...
-
gopy6243
 on:
Exploring Simple Scenario Analysis in Power BI: In...
on:
Exploring Simple Scenario Analysis in Power BI: In...
-
ajaybabuinturi
on:
How to Create Reusable Power BI Sample Data Using ...
- Presi on: Understanding about The Pivot, Unpivot and Transpo...
-
axlrn
on:
QuickViz Challenge | Raise the Bar!
-
How To
737 -
Tips & Tricks
717 -
Events
179 -
Support insights
121 -
Opinion
91 -
DAX
66 -
Power BI
65 -
Power Query
62 -
Power BI Dev Camp
45 -
Power BI Desktop
40 -
Roundup
38 -
Dataflow
31 -
Featured User Group Leader
27 -
Power BI Embedded
20 -
Time Intelligence
19 -
Tips&Tricks
18 -
Data Protection
16 -
PowerBI REST API
12 -
Power BI Service
8 -
Power Query Tips & Tricks
8 -
finance
8 -
Direct Query
7 -
Auto ML
6 -
financial reporting
6 -
Data Analysis
6 -
Power Automate
6 -
Data Visualization
6 -
Python
6 -
Tips and Tricks
6 -
Power BI REST API
6 -
powerbi
5 -
service
5 -
Power BI PowerShell
5 -
Machine Learning
5 -
Income Statement
5 -
Dax studio
5 -
Power BI Goals
4 -
Desktop
4 -
PowerShell
4 -
Bookmarks
4 -
Line chart
4 -
Group By
4 -
community
4 -
RLS
4 -
M language
4 -
Life Sciences
4 -
Paginated Reports
4 -
External tool
4 -
Webinar
3 -
calendar
3 -
Gateways
3 -
R
3 -
M Query
3 -
CALCULATE
3 -
R visual
3 -
Reports
3 -
PowerApps
3 -
Data Science
3 -
Azure
3 -
Data model
3 -
Conditional Formatting
3 -
Visualisation
3 -
Administration
3 -
M code
3 -
Visuals
3 -
SQL Server 2017 Express Edition
3 -
R script
3 -
Aggregation
3 -
parameter
2 -
Industrial App Store
2 -
Week
2 -
Date duration
2 -
Formatting
2 -
Weekday Calendar
2 -
Support insights.
2 -
construct list
2 -
slicers
2 -
SAP
2 -
Power Platform
2 -
Workday
2 -
external tools
2 -
index
2 -
RANKX
2 -
Date
2 -
PBI Desktop
2 -
Date Dimension
2 -
Integer
2 -
Visualization
2 -
Power BI Challenge
2 -
Query Parameter
2 -
SharePoint
2 -
Power BI Installation and Updates
2 -
How Things Work
2 -
Tabular Editor
2 -
rank
2 -
ladataweb
2 -
Troubleshooting
2 -
Date DIFF
2 -
Transform data
2 -
Healthcare
2 -
Incremental Refresh
2 -
Number Ranges
2 -
Query Plans
2 -
Power BI & Power Apps
2 -
Random numbers
2 -
Day of the Week
2 -
Custom visual
2 -
VLOOKUP
2 -
pivot
2 -
calculated column
2 -
M
2 -
hierarchies
2 -
Power BI Anniversary
2 -
Language M
2 -
inexact
2 -
Date Comparison
2 -
Power BI Premium Per user
2 -
Forecasting
2 -
REST API
2 -
Editor
2 -
Split
2 -
measure
2 -
Microsoft-flow
2 -
Paginated Report Builder
2 -
Working with Non Standatd Periods
2 -
powerbi.tips
2 -
Custom function
2 -
Reverse
2 -
PUG
2 -
Custom Measures
2 -
Filtering
2 -
Row and column conversion
2 -
Python script
2 -
Nulls
2 -
DVW Analytics
2 -
Training
1 -
Event
1 -
Custom Visuals
1 -
Free vs Pro
1 -
Format
1 -
Active Employee
1 -
Custom Date Range on Date Slicer
1 -
refresh error
1 -
PAS
1 -
certain duration
1 -
DA-100
1 -
bulk renaming of columns
1 -
Single Date Picker
1 -
Monday
1 -
PCS
1 -
Saturday
1 -
Slicer
1 -
Visual
1 -
forecast
1 -
Regression
1 -
CICD
1 -
Current Employees
1 -
date hierarchy
1 -
relationship
1 -
SIEMENS
1 -
Multiple Currency
1 -
Power BI Premium
1 -
On-premises data gateway
1 -
Binary
1 -
Power BI Connector for SAP
1 -
Sunday
1 -
Workspace
1 -
Announcement
1 -
Features
1 -
domain
1 -
pbiviz
1 -
sport statistics
1 -
Intelligent Plant
1 -
Circular dependency
1 -
GE
1 -
Exchange rate
1 -
Dendrogram
1 -
range of values
1 -
activity log
1 -
Decimal
1 -
Charticulator Challenge
1 -
Field parameters
1 -
deployment
1 -
ssrs traffic light indicators
1 -
SQL
1 -
trick
1 -
Scripts
1 -
Color Map
1 -
Industrial
1 -
Weekday
1 -
Working Date
1 -
Space Issue
1 -
Emerson
1 -
Date Table
1 -
Cluster Analysis
1 -
Stacked Area Chart
1 -
union tables
1 -
Number
1 -
Start of Week
1 -
Tips& Tricks
1 -
Theme Colours
1 -
Text
1 -
Flow
1 -
Publish to Web
1 -
Extract
1 -
Topper Color On Map
1 -
Historians
1 -
context transition
1 -
Custom textbox
1 -
OPC
1 -
Zabbix
1 -
Label: DAX
1 -
Business Analysis
1 -
Supporting Insight
1 -
rank value
1 -
Synapse
1 -
End of Week
1 -
Tips&Trick
1 -
Excel
1 -
Showcase
1 -
custom connector
1 -
Waterfall Chart
1 -
Power BI On-Premise Data Gateway
1 -
patch
1 -
Top Category Color
1 -
A&E data
1 -
Previous Order
1 -
Substring
1 -
Wonderware
1 -
Power M
1 -
Format DAX
1 -
Custom functions
1 -
accumulative
1 -
DAX&Power Query
1 -
Premium Per User
1 -
GENERATESERIES
1 -
Report Server
1 -
Audit Logs
1 -
analytics pane
1 -
step by step
1 -
Top Brand Color on Map
1 -
Tutorial
1 -
Previous Date
1 -
XMLA End point
1 -
color reference
1 -
Date Time
1 -
Marker
1 -
Lineage
1 -
CSV file
1 -
conditional accumulative
1 -
Matrix Subtotal
1 -
Check
1 -
null value
1 -
Show and Tell
1 -
Cumulative Totals
1 -
Report Theme
1 -
Bookmarking
1 -
oracle
1 -
mahak
1 -
pandas
1 -
Networkdays
1 -
Button
1 -
Dataset list
1 -
Keyboard Shortcuts
1 -
Fill Function
1 -
LOOKUPVALUE()
1 -
Tips &Tricks
1 -
Plotly package
1 -
Sameperiodlastyear
1 -
Office Theme
1 -
matrix
1 -
bar chart
1 -
Measures
1 -
powerbi argentina
1 -
Canvas Apps
1 -
total
1 -
Filter context
1 -
Difference between two dates
1 -
get data
1 -
OSI
1 -
Query format convert
1 -
ETL
1 -
Json files
1 -
Merge Rows
1 -
CONCATENATEX()
1 -
take over Datasets;
1 -
Networkdays.Intl
1 -
refresh M language Python script Support Insights
1 -
Tutorial Requests
1 -
Governance
1 -
Fun
1 -
Power BI gateway
1 -
gateway
1 -
Elementary
1 -
Custom filters
1 -
Vertipaq Analyzer
1 -
powerbi cordoba
1 -
Model Driven Apps
1 -
REMOVEFILTERS
1 -
XMLA endpoint
1 -
translations
1 -
OSI pi
1 -
Parquet
1 -
Change rows to columns
1 -
remove spaces
1 -
Get row and column totals
1 -
Retail
1 -
Power BI Report Server
1 -
School
1 -
Cost-Benefit Analysis
1 -
DIisconnected Tables
1 -
Sandbox
1 -
Honeywell
1 -
Combine queries
1 -
X axis at different granularity
1 -
ADLS
1 -
Primary Key
1 -
Microsoft 365 usage analytics data
1 -
Randomly filter
1 -
Week of the Day
1 -
Azure AAD
1 -
query
1 -
Dynamic Visuals
1 -
KPI
1 -
Intro
1 -
Icons
1 -
ISV
1 -
Ties
1 -
unpivot
1 -
Practice Model
1 -
Continuous streak
1 -
ProcessVue
1 -
Create function
1 -
Table.Schema
1 -
Acknowledging
1 -
Postman
1 -
Text.ContainsAny
1 -
Power BI Show
1 -
Get latest sign-in data for each user
1 -
Power Pivot
1 -
API
1 -
Kingsley
1 -
Merge
1 -
variable
1 -
Issues
1 -
function
1 -
stacked column chart
1 -
ho
1 -
ABB
1 -
KNN algorithm
1 -
List.Zip
1 -
optimization
1 -
Artificial Intelligence
1 -
Map Visual
1 -
Text.ContainsAll
1 -
Tuesday
1 -
help
1 -
group
1 -
Scorecard
1 -
Json
1 -
Tops
1 -
financial reporting hierarchies RLS
1 -
Featured Data Stories
1 -
MQTT
1 -
Custom Periods
1 -
Partial group
1 -
Reduce Size
1 -
FBL3N
1 -
Wednesday
1 -
Q&A
1 -
Quick Tips
1 -
data
1 -
PBIRS
1 -
Usage Metrics in Power BI
1 -
Multivalued column
1 -
Pipeline
1 -
Path
1 -
Yokogawa
1 -
Dynamic calculation
1 -
Data Wrangling
1 -
native folded query
1 -
transform table
1 -
UX
1 -
Cell content
1 -
General Ledger
1 -
Thursday
1 -
update
1 -
Table
1 -
Natural Query Language
1 -
Infographic
1 -
automation
1 -
Prediction
1 -
newworkspacepowerbi
1 -
Performance KPIs
1 -
HR Analytics
1 -
keepfilters
1 -
Connect Data
1 -
Financial Year
1 -
Schneider
1 -
dynamically delete records
1 -
Copy Measures
1 -
Friday
1
- 11-23-2025 - 11-29-2025
- 11-16-2025 - 11-22-2025
- 11-09-2025 - 11-15-2025
- 11-02-2025 - 11-08-2025
- 10-26-2025 - 11-01-2025
- 10-19-2025 - 10-25-2025
- 10-12-2025 - 10-18-2025
- 10-05-2025 - 10-11-2025
- 09-28-2025 - 10-04-2025
- 09-21-2025 - 09-27-2025
- 09-14-2025 - 09-20-2025
- 09-07-2025 - 09-13-2025
- 08-31-2025 - 09-06-2025
- View Complete Archives