Join us at the 2025 Microsoft Fabric Community Conference
Microsoft Fabric Community Conference 2025, March 31 - April 2, Las Vegas, Nevada. Use code MSCUST for a $150 discount.
Register now- Power BI forums
- Get Help with Power BI
- Desktop
- Service
- Report Server
- Power Query
- Mobile Apps
- Developer
- DAX Commands and Tips
- Custom Visuals Development Discussion
- Health and Life Sciences
- Power BI Spanish forums
- Translated Spanish Desktop
- Training and Consulting
- Instructor Led Training
- Dashboard in a Day for Women, by Women
- Galleries
- Webinars and Video Gallery
- Data Stories Gallery
- Themes Gallery
- Contests Gallery
- Quick Measures Gallery
- R Script Showcase
- COVID-19 Data Stories Gallery
- Community Connections & How-To Videos
- 2021 MSBizAppsSummit Gallery
- 2020 MSBizAppsSummit Gallery
- 2019 MSBizAppsSummit Gallery
- Events
- Ideas
- Custom Visuals Ideas
- Issues
- Issues
- Events
- Upcoming Events
The Power BI DataViz World Championships are on! With four chances to enter, you could win a spot in the LIVE Grand Finale in Las Vegas. Show off your skills.
- Power BI forums
- Forums
- Get Help with Power BI
- Desktop
- Re: Unexpected Tooltip Page Behavior
- Subscribe to RSS Feed
- Mark Topic as New
- Mark Topic as Read
- Float this Topic for Current User
- Bookmark
- Subscribe
- Printer Friendly Page
- Mark as New
- Bookmark
- Subscribe
- Mute
- Subscribe to RSS Feed
- Permalink
- Report Inappropriate Content
Unexpected Tooltip Page Behavior
Hi,
I have run into something that seems interesting with the a tooltip page.
I have a simple dataset:
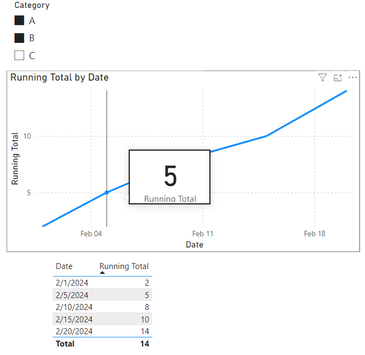
I create a chart to show a running total:
I then create a tooltip page that the chart references. It uses the same running total measure. Everything works as expected.
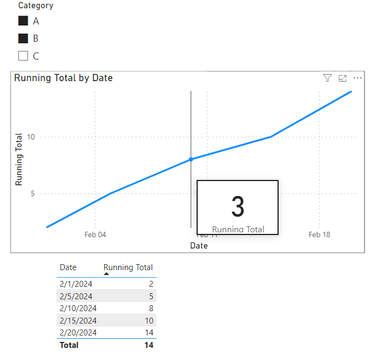
However, here is where it gets interesting. If I add a slicer and filter to two categories, the tooltip starts to not work as I would expect:
It's as if the tooltip (located on a tooltip page) is being affected by the category. But the chart, which uses the same running total measure, is not. Bc the chart is still calculating the running total line correctly. And this unexpected behavior only happens when I apply the slicer.
Any thoughts on what's causing this and how to get the tooltip to work as I would expect and still show a running total?
If it helps, I can try and share this demo report in drop box.
- Mark as New
- Bookmark
- Subscribe
- Mute
- Subscribe to RSS Feed
- Permalink
- Report Inappropriate Content
Thanks for the reply from @amitchandak , please allow me to provide another insight:
Hi @kewaynes ,
According to research, my side shows normal values and cannot reproduce your scenario.
You can check to see if there are other tables associated with the table that are causing the data not to display properly
Make sure you have the latest version of Power BI Desktop:
Download Power BI Desktop from Official Microsoft Download Center
Can you share sample data and sample output in table format? Or a sample pbix after removing sensitive data. We can better understand the problem and help you
Best Regards,
Liu Yang
If this post helps, then please consider Accept it as the solution to help the other members find it more quickly
- Mark as New
- Bookmark
- Subscribe
- Mute
- Subscribe to RSS Feed
- Permalink
- Report Inappropriate Content
Hi Lui,
It won't let me add the file here. What's the easiest way for me to send it to you? Email?
- Mark as New
- Bookmark
- Subscribe
- Mute
- Subscribe to RSS Feed
- Permalink
- Report Inappropriate Content
- Mark as New
- Bookmark
- Subscribe
- Mute
- Subscribe to RSS Feed
- Permalink
- Report Inappropriate Content
Thanks for the response. Keep all filters is indeed turned on in the tooltip page.


