Join us at the 2025 Microsoft Fabric Community Conference
March 31 - April 2, 2025, in Las Vegas, Nevada. Use code MSCUST for a $150 discount! Early bird discount ends December 31.
Register Now- Power BI forums
- Get Help with Power BI
- Desktop
- Service
- Report Server
- Power Query
- Mobile Apps
- Developer
- DAX Commands and Tips
- Custom Visuals Development Discussion
- Health and Life Sciences
- Power BI Spanish forums
- Translated Spanish Desktop
- Training and Consulting
- Instructor Led Training
- Dashboard in a Day for Women, by Women
- Galleries
- Community Connections & How-To Videos
- COVID-19 Data Stories Gallery
- Themes Gallery
- Data Stories Gallery
- R Script Showcase
- Webinars and Video Gallery
- Quick Measures Gallery
- 2021 MSBizAppsSummit Gallery
- 2020 MSBizAppsSummit Gallery
- 2019 MSBizAppsSummit Gallery
- Events
- Ideas
- Custom Visuals Ideas
- Issues
- Issues
- Events
- Upcoming Events
Be one of the first to start using Fabric Databases. View on-demand sessions with database experts and the Microsoft product team to learn just how easy it is to get started. Watch now
- Power BI forums
- Forums
- Get Help with Power BI
- Desktop
- How do I enable two filters across different visua...
- Subscribe to RSS Feed
- Mark Topic as New
- Mark Topic as Read
- Float this Topic for Current User
- Bookmark
- Subscribe
- Printer Friendly Page
- Mark as New
- Bookmark
- Subscribe
- Mute
- Subscribe to RSS Feed
- Permalink
- Report Inappropriate Content
How do I enable two filters across different visuals, when only one Relationship can be set?
Hello
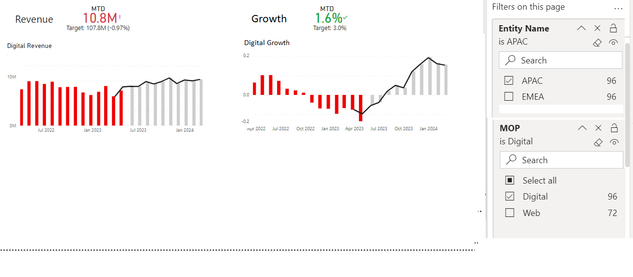
In my PBI report, I have 2 bar/line charts and 2 KPI visuals. I would like to have Page filters that can filter below:
Entity: Either APAC or EMEA
MOP: Either Digital or Web
I am facing two problems:
1) I would like the "Growth" numbers to show in % and "Revenue" in decimals. I don't think this can be done if only one sheet of dataset is used?
2) I would like both "Entity Name" and "MOP" filters to operate independently and able to affect all 4 visuals on a page level. So the user has 4 combinations to view all 4 visuals (APAC+Digital, APAC+Web, EMEA+Digital, EMEA+Web).
I tried to fix problem#1 by having one page of dataset for "Growth" in % format, then have another page of dataset for "Revenue" in $$. But this causes an issue with problem #2, because I can only create one relationship between the Data Sets: either "Entity Name" or "MOP", but not both.
Alternatively I can fix problem#2 by having both "Revenue" and "Growth" in one page of dataset, but the formatting will have to be either all in $$ or all in %? Each column of data can only be either percentage or number?
How can I fix both problems together? This would mean all "Revenue" is shown in decimal, all "Growth" is shown in %, and all 4 filters (APAC/EMEA/Digital/Web) can be toggled indepedently to affect all 4 visuals.
Thanks for any help.
- Mark as New
- Bookmark
- Subscribe
- Mute
- Subscribe to RSS Feed
- Permalink
- Report Inappropriate Content
@PBIMakesMeHigh , We can measure for Growth % and "Revenue" and that can have different formats.
if they are coming from two tables having many to many join consider a bridge table.
Also, consider a slicer or visual-level filter
Can you share sample data and sample output in table format? Or a sample pbix after removing sensitive data.
Power BI- DAX: When I asked you to create common tables: https://youtu.be/a2CrqCA9geM
At the Microsoft Analytics Community Conference, global leaders and influential voices are stepping up to share their knowledge and help you master the latest in Microsoft Fabric, Copilot, and Purview. ✨
️ November 12th-14th, 2024
Online Event
Register Here
Helpful resources

Join us at the Microsoft Fabric Community Conference
March 31 - April 2, 2025, in Las Vegas, Nevada. Use code MSCUST for a $150 discount!

We want your feedback!
Your insights matter. That’s why we created a quick survey to learn about your experience finding answers to technical questions.

Microsoft Fabric Community Conference 2025
Arun Ulag shares exciting details about the Microsoft Fabric Conference 2025, which will be held in Las Vegas, NV.

| User | Count |
|---|---|
| 124 | |
| 87 | |
| 85 | |
| 70 | |
| 51 |
| User | Count |
|---|---|
| 205 | |
| 153 | |
| 97 | |
| 79 | |
| 69 |

