Join the #PBI10 DataViz contest
Power BI is turning 10, and we’re marking the occasion with a special community challenge. Use your creativity to tell a story, uncover trends, or highlight something unexpected.
Get started- Power BI forums
- Get Help with Power BI
- Desktop
- Service
- Report Server
- Power Query
- Mobile Apps
- Developer
- DAX Commands and Tips
- Custom Visuals Development Discussion
- Health and Life Sciences
- Power BI Spanish forums
- Translated Spanish Desktop
- Training and Consulting
- Instructor Led Training
- Dashboard in a Day for Women, by Women
- Galleries
- Webinars and Video Gallery
- Data Stories Gallery
- Themes Gallery
- Contests Gallery
- Quick Measures Gallery
- Notebook Gallery
- Translytical Task Flow Gallery
- R Script Showcase
- Ideas
- Custom Visuals Ideas (read-only)
- Issues
- Issues
- Events
- Upcoming Events
Join us for an expert-led overview of the tools and concepts you'll need to become a Certified Power BI Data Analyst and pass exam PL-300. Register now.
- Power BI forums
- Forums
- Get Help with Power BI
- DAX Commands and Tips
- How to create relative date filter using dax
- Subscribe to RSS Feed
- Mark Topic as New
- Mark Topic as Read
- Float this Topic for Current User
- Bookmark
- Subscribe
- Printer Friendly Page
- Mark as New
- Bookmark
- Subscribe
- Mute
- Subscribe to RSS Feed
- Permalink
- Report Inappropriate Content
How to create relative date filter using dax
Hi everyone,
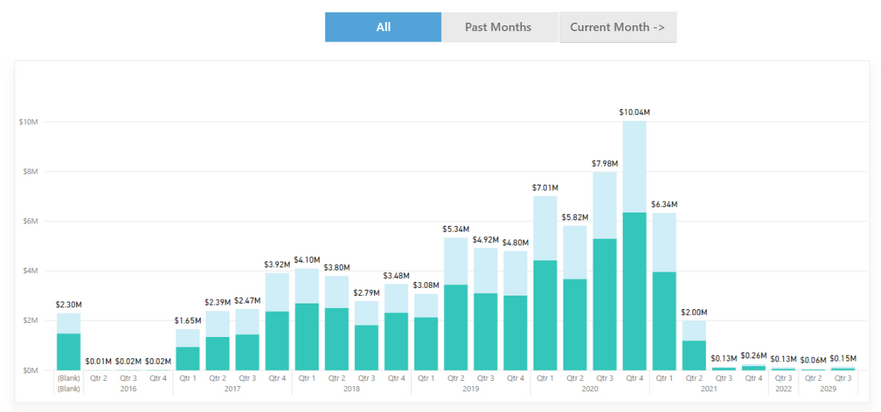
I am trying to create a measure to filter my graph based on relative dates. but my measure is not working unfortunately
My default graph looks like
I'd like that if i click Previous Months button, it should display all past data until end of last month (September 30 2020).
IF current month is Nov 2020, i should see all past data until end of last month (oct 31 2020) and so on.
and if i click the Current Month -> button, it should only display values from current month (from Oct 1 2020) until the max date with value. if current month = December, i should see all data from dec 1 2020 until the max date with value.
i have a calendar table (Date) that is linked to my transactions table (Client Ddate). what i did is i created a calculated column inside Calendar table:
then created measures to filter the past dates and current + future dates
I hope you can help me with this. Thank you so much in advance!
Solved! Go to Solution.
- Mark as New
- Bookmark
- Subscribe
- Mute
- Subscribe to RSS Feed
- Permalink
- Report Inappropriate Content
@Anonymous , refer if this old solution can be bit of help
For this month vs last month use time intelligence with date table
MTD Sales = CALCULATE(SUM(Sales[Sales Amount]),DATESMTD('Date'[Date]))
last MTD Sales = CALCULATE(SUM(Sales[Sales Amount]),DATESMTD(dateadd('Date'[Date],-1,MONTH)))
last month Sales = CALCULATE(SUM(Sales[Sales Amount]),previousmonth('Date'[Date]))
this month =MTD Sales = CALCULATE(SUM(Sales[Sales Amount]),DATESMTD(ENDOFMONTH('Date'[Date])))
last MTD (complete) Sales = CALCULATE(SUM(Sales[Sales Amount]),DATESMTD(ENDOFMONTH(dateadd('Date'[Date],-1,MONTH))))
previous month value = CALCULATE(sum(''Table''[total hours value]),previousmonth('Date'[Date]))
diff = [MTD Sales]-[last MTD Sales]
diff % = divide([MTD Sales]-[last MTD Sales],[last MTD Sales])
Power BI — Qtr on Qtr with or Without Time Intelligence
https://medium.com/@amitchandak.1978/power-bi-qtd-questions-time-intelligence-2-5-d842063da839
To get the best of the time intelligence function. Make sure you have a date calendar and it has been marked as the date in model view. Also, join it with the date column of your fact/s. Refer :radacad sqlbi My Video Series Appreciate your Kudos.
Please provide your feedback comments and advice for new videos
Tutorial Series Dax Vs SQL Direct Query PBI Tips
Appreciate your Kudos.
- Mark as New
- Bookmark
- Subscribe
- Mute
- Subscribe to RSS Feed
- Permalink
- Report Inappropriate Content
i am using relative date slicer
same i want to display in other card visual start date and end date from that slicer
- Mark as New
- Bookmark
- Subscribe
- Mute
- Subscribe to RSS Feed
- Permalink
- Report Inappropriate Content
Hi @amitchandak really sorry i totally forgot to respond to you. Anyway, thank you so much for your solution. it worked perfectly. I appreciate it very very much.
- Mark as New
- Bookmark
- Subscribe
- Mute
- Subscribe to RSS Feed
- Permalink
- Report Inappropriate Content
@Anonymous , refer if this old solution can be bit of help
For this month vs last month use time intelligence with date table
MTD Sales = CALCULATE(SUM(Sales[Sales Amount]),DATESMTD('Date'[Date]))
last MTD Sales = CALCULATE(SUM(Sales[Sales Amount]),DATESMTD(dateadd('Date'[Date],-1,MONTH)))
last month Sales = CALCULATE(SUM(Sales[Sales Amount]),previousmonth('Date'[Date]))
this month =MTD Sales = CALCULATE(SUM(Sales[Sales Amount]),DATESMTD(ENDOFMONTH('Date'[Date])))
last MTD (complete) Sales = CALCULATE(SUM(Sales[Sales Amount]),DATESMTD(ENDOFMONTH(dateadd('Date'[Date],-1,MONTH))))
previous month value = CALCULATE(sum(''Table''[total hours value]),previousmonth('Date'[Date]))
diff = [MTD Sales]-[last MTD Sales]
diff % = divide([MTD Sales]-[last MTD Sales],[last MTD Sales])
Power BI — Qtr on Qtr with or Without Time Intelligence
https://medium.com/@amitchandak.1978/power-bi-qtd-questions-time-intelligence-2-5-d842063da839
To get the best of the time intelligence function. Make sure you have a date calendar and it has been marked as the date in model view. Also, join it with the date column of your fact/s. Refer :radacad sqlbi My Video Series Appreciate your Kudos.
Please provide your feedback comments and advice for new videos
Tutorial Series Dax Vs SQL Direct Query PBI Tips
Appreciate your Kudos.
Helpful resources

Join our Fabric User Panel
This is your chance to engage directly with the engineering team behind Fabric and Power BI. Share your experiences and shape the future.

Power BI Monthly Update - June 2025
Check out the June 2025 Power BI update to learn about new features.

| User | Count |
|---|---|
| 10 | |
| 9 | |
| 8 | |
| 8 | |
| 8 |
| User | Count |
|---|---|
| 13 | |
| 12 | |
| 11 | |
| 10 | |
| 8 |


