- Power BI forums
- Updates
- News & Announcements
- Get Help with Power BI
- Desktop
- Service
- Report Server
- Power Query
- Mobile Apps
- Developer
- DAX Commands and Tips
- Custom Visuals Development Discussion
- Health and Life Sciences
- Power BI Spanish forums
- Translated Spanish Desktop
- Power Platform Integration - Better Together!
- Power Platform Integrations (Read-only)
- Power Platform and Dynamics 365 Integrations (Read-only)
- Training and Consulting
- Instructor Led Training
- Dashboard in a Day for Women, by Women
- Galleries
- Community Connections & How-To Videos
- COVID-19 Data Stories Gallery
- Themes Gallery
- Data Stories Gallery
- R Script Showcase
- Webinars and Video Gallery
- Quick Measures Gallery
- 2021 MSBizAppsSummit Gallery
- 2020 MSBizAppsSummit Gallery
- 2019 MSBizAppsSummit Gallery
- Events
- Ideas
- Custom Visuals Ideas
- Issues
- Issues
- Events
- Upcoming Events
- Community Blog
- Power BI Community Blog
- Custom Visuals Community Blog
- Community Support
- Community Accounts & Registration
- Using the Community
- Community Feedback
Register now to learn Fabric in free live sessions led by the best Microsoft experts. From Apr 16 to May 9, in English and Spanish.
- Power BI forums
- Forums
- Get Help with Power BI
- DAX Commands and Tips
- Re: 90th Percentile Issues (Not displaying correct...
- Subscribe to RSS Feed
- Mark Topic as New
- Mark Topic as Read
- Float this Topic for Current User
- Bookmark
- Subscribe
- Printer Friendly Page
- Mark as New
- Bookmark
- Subscribe
- Mute
- Subscribe to RSS Feed
- Permalink
- Report Inappropriate Content
90th Percentile Issues (Not displaying correctly)
I am having issues with capturing the 90th percentile of a given set of data. I have used all the percentile forumals below with no luck. While it returns results, they seem to be incorrect.
- PERCENTILE.EXC('Public-Dashboard'[Unit Turnout Time],0.9)
- PERCENTILE.INC('Public-Dashboard'[Unit Turnout Time],0.9)
- PERCENTILEX.EXC('Public-Dashboard',[Unit Turnout Time], 0.9)
- PERCENTILEX.INC('Public-Dashboard',[Unit Turnout Time],0.9)
Below is a certain set of data where you can see the results of the forumla are returning incorrect results as I did the calculation manually on paper. As you know a normal 90th percentile formula would be calculated as the following steps.
- Put data in chronological order
- Count how many data points you have (in the example below it would be 23)
- Take 23 * 0.9 which returns 20.7
- Your 90th percent would be the 21st number or 20th number.
Based on the images below I would assume it would be 110 or 118.
Solved! Go to Solution.
- Mark as New
- Bookmark
- Subscribe
- Mute
- Subscribe to RSS Feed
- Permalink
- Report Inappropriate Content
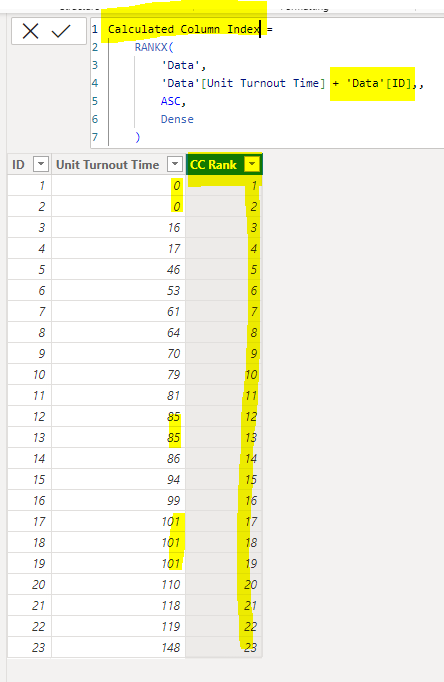
Yes. If you do not already have an Index, you can create a Calculated Column as follows.
NOTE: I am assuming you have an ID in your table. Since you have duplicate values in the Unit Turnout Time, you need a way to differentiate between duplicates to assign different ranks for the same Unit Turnout Time. In this example, I'm simply adding the ID to the Unit Turnout Time to get a unique value on which to properly rank all values.
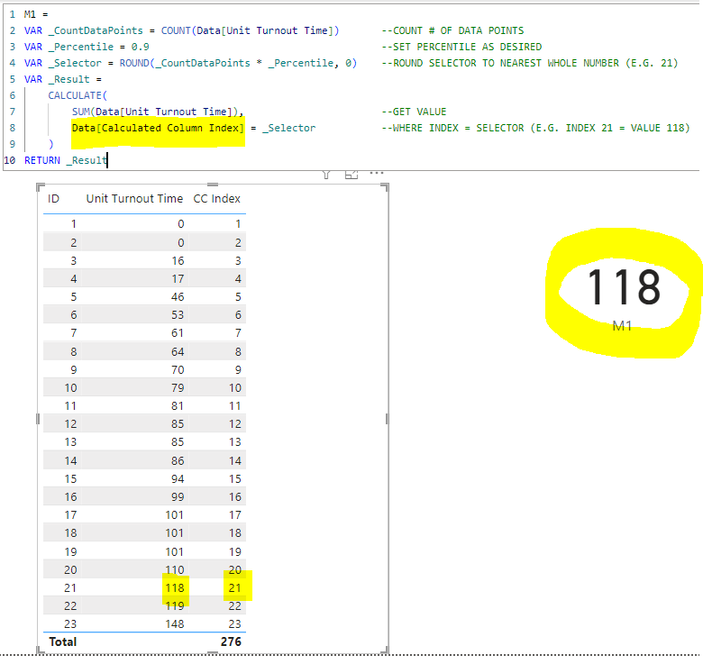
Once your Index column exists, just update the measure to refer to it inside the CALCULATE.
Hope this makes sense.
Nathan
- Mark as New
- Bookmark
- Subscribe
- Mute
- Subscribe to RSS Feed
- Permalink
- Report Inappropriate Content
Yeah, I'm out of ideas unfortunately.
A solid data source should have a unique ID column in each table in the model.
Without a unique ID, we have no way of ranking the Unit Turnout Time due to duplicate values.
And without being able to rank the values, how can Power BI be able to identify the Nth value in the list (in this case the 21st)? It cannot.
Perhaps someone else in the community knows of a different route to take?
I am sorry I was not able to provide a solution.
Regards,
Nathan
- Mark as New
- Bookmark
- Subscribe
- Mute
- Subscribe to RSS Feed
- Permalink
- Report Inappropriate Content
Don't be sorry, you helped tremendously. I will work on seeing if I can get a unique ID to drop in with the data.
- Mark as New
- Bookmark
- Subscribe
- Mute
- Subscribe to RSS Feed
- Permalink
- Report Inappropriate Content
Yes. If you do not already have an Index, you can create a Calculated Column as follows.
NOTE: I am assuming you have an ID in your table. Since you have duplicate values in the Unit Turnout Time, you need a way to differentiate between duplicates to assign different ranks for the same Unit Turnout Time. In this example, I'm simply adding the ID to the Unit Turnout Time to get a unique value on which to properly rank all values.
Once your Index column exists, just update the measure to refer to it inside the CALCULATE.
Hope this makes sense.
Nathan
- Mark as New
- Bookmark
- Subscribe
- Mute
- Subscribe to RSS Feed
- Permalink
- Report Inappropriate Content
@WinterMist - I am not sure if what I am trying accomplish is going to work or either i'm losing faith. I don't have any sort of ID in the table either. Here is a quick snipit of the actual table and the sepcific data in said table.
So for example, each unit has its own turnout time for each specific incident. I am wanting to take the turnout time for said unit and display it in th e 90th percentile accounting for specific slicer filters (that is another conversation).
- Mark as New
- Bookmark
- Subscribe
- Mute
- Subscribe to RSS Feed
- Permalink
- Report Inappropriate Content
@WinterMist - I attempted to use the formula you added above, it returned no value under 90th Percentile.
- Mark as New
- Bookmark
- Subscribe
- Mute
- Subscribe to RSS Feed
- Permalink
- Report Inappropriate Content
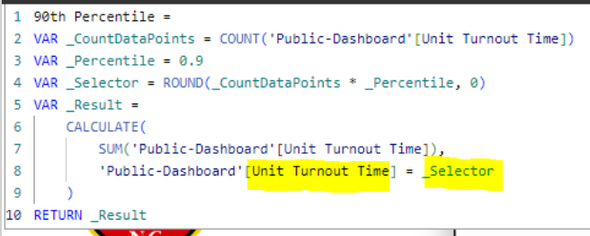
That is because of the highlighted line in your measure below.
The CALCULATE is asking for the Unit Turnout Time where Unit Turnout Time = 21.
But there is no value in Unit Turnout Time of 21. So it returns nothing.
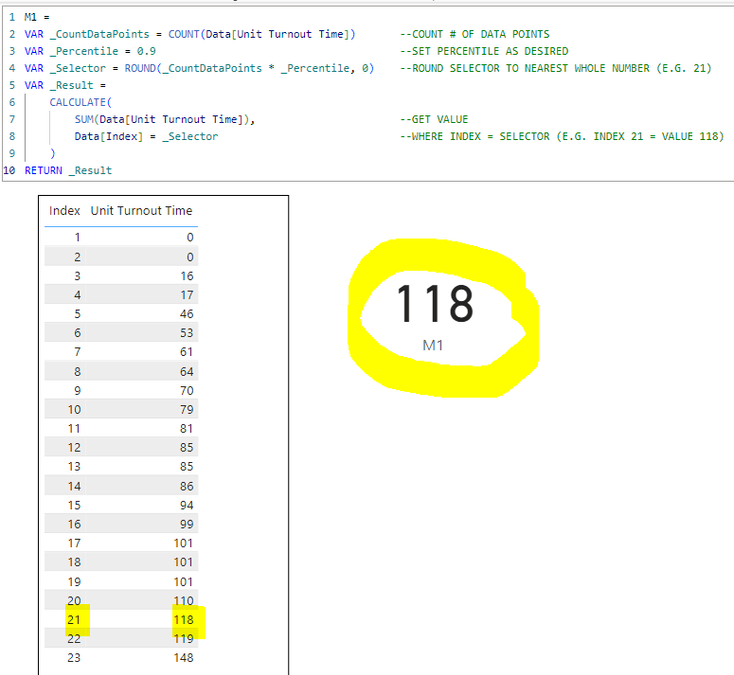
Instead, you want to get the Unit Turnout Time for the 21st record in the list.
This is why I used an Index / Linenumber column, that simply tells you what the linenumber is.
The highlighted line in the measure below is asking for the Unit Turnout Time WHERE Index (i.e. Linenumber) = 21. In this case, Index 21 exists, and is able to find the result.
Does this make sense?
- Mark as New
- Bookmark
- Subscribe
- Mute
- Subscribe to RSS Feed
- Permalink
- Report Inappropriate Content
@WinterMist - Yes it makes perfect sense so my question is how can I take the following data and 'select' the right number? Do I need to add an index colum so each turnout time has a specific index number to go with? Ultimately I would like like for it to display the number selected vs showing the entire list of turnout times.
I am open to communicate elsewhere if we need to.
- Mark as New
- Bookmark
- Subscribe
- Mute
- Subscribe to RSS Feed
- Permalink
- Report Inappropriate Content
Helpful resources

Microsoft Fabric Learn Together
Covering the world! 9:00-10:30 AM Sydney, 4:00-5:30 PM CET (Paris/Berlin), 7:00-8:30 PM Mexico City

Power BI Monthly Update - April 2024
Check out the April 2024 Power BI update to learn about new features.

| User | Count |
|---|---|
| 46 | |
| 26 | |
| 21 | |
| 12 | |
| 8 |
| User | Count |
|---|---|
| 75 | |
| 51 | |
| 45 | |
| 15 | |
| 12 |


