html
10 Topics
Power BI Super Tooltips by DAX
This post introduces a more powerful tooltip solution than Power BI's built-in tooltips: No need to create a tooltip page A single chart (visual) can have more than one tooltip Different tooltip pages for the same chart can vary in size This super tooltip is suitable for various chart scenarios. The implementation technique involves DAX + HTML + CSS + SVG, and the code principles are straightforward, making it easy to learn even for beginners. Below, adding tooltips to long text is used as an example, but the same principles apply to other types. Here is an example of HTML measure, with the following effect: When hovering over text A, a red circle appears. When hovering over text B, a blue rectangle appears. Place the measure in HTML Content visual to see the result. M.原理 = " <head> <style> /* 指定字号 */ p { font-size: 24px; } /* 指定添加工具提示文字的颜色 */ .hover-text { color: #3498db; } /* 当鼠标悬停在需要工具提示的文字时,添加下划线 */ .hover-text:hover { text-decoration: underline; } /* 默认将工具提示的SVG图表隐藏 */ .svg-tooltip { position: absolute; visibility: hidden; } /* 鼠标悬停时显示SVG图表 */ .hover-text:hover + .svg-tooltip { visibility: visible; } </style> </head> <body> <p>这是一个展示超级工具提示的段落。当鼠标悬停在 <span class='hover-text'>文字A</span> <svg class='svg-tooltip' width='100' height='100'> <circle cx='50' cy='50' r='45' fill='red'/> </svg> 上时,会出现一个红色的圆形。而当你悬停在 <span class='hover-text'>文字B</span> <svg class='svg-tooltip' width='200' height='80'> <rect x='0' y='0' rx='20' width='200' height='80' fill='deepskyblue'/> </svg> 上时,会出现一个蓝色的长正方形。 </p> </body>"Solved1KViews3likes2CommentsSVG HTML Charts UDFs
FUNCTION SVG_Shape = (IconIndex:numeric,Color:string)=> "data:image/svg+xml;utf8,<svg xmlns='http://www.w3.org/2000/svg' id='wujunmin' width='48' height='48'>" & SWITCH(IconIndex, 1,"<rect rx='24' x='0' y='0' width='48' height='48' fill='" & Color & "'/>", 2,"<rect rx='5' x='0' y='0' width='48' height='48' fill='" & Color & "'/>", 3,"<path d='M5.41421 22.5858L22.5858 5.41421C23.3668 4.63317 24.6332 4.63316 25.4142 5.41421L42.5858 22.5858C43.3668 23.3668 43.3668 24.6332 42.5858 25.4142L25.4142 42.5858C24.6332 43.3668 23.3668 43.3668 22.5858 42.5858L5.41421 25.4142C4.63317 24.6332 4.63316 23.3668 5.41421 22.5858Z' fill='" & Color & "'/>", 4,"<circle cx='24' cy='24' r='20' stroke='" & Color & "' fill='none' stroke-width='2'/>") & " </svg>" e.g. Measure = SVG_Shape(3,if([M.KPI]>=0.5,"green","rgb(255,0,0)")) FUNCTION SVG_Text_Icon = (TextIcon:string,BackgroundColor:string,FontColor:string)=> "data:image/svg+xml;utf8,<svg xmlns='http://www.w3.org/2000/svg' id='wujunmin' width='96' height='96'> <rect rx='5' x='0' y='0' width='96' height='96' fill='" & BackgroundColor & "'/> <text x='48' y='48' text-anchor='middle' dominant-baseline='central' font-size='60' fill='" & FontColor & "'>" & TextIcon & "</text1> </svg>" e.g. Measure = SVG_Text_Icon(IF([M.KPI]>=1,"A","B"), IF([M.KPI]>=1,"green","red") ,"snow") FUNCTION SVG_Rank = (ColumnRank:anyref,MeasureRank:numeric expr,BackgroundColor:string)=> "data:image/svg+xml;utf8,<svg xmlns='http://www.w3.org/2000/svg' id='wujunmin' width='96' height='96'> <rect rx='48' x='0' y='0' width='96' height='96' fill='" & BackgroundColor & "'/> <text x='48' y='48' text-anchor='middle' dominant-baseline='central' font-size='60' fill='snow'>" & RANKX(ALLSELECTED(ColumnRank),MeasureRank) & "</text> </svg>" e.g. Measure = SVG_Rank('store'[storeID],[M.sales],"brown") FUNCTION SVG_Bar = (ColumnForBar:anyref,MeasureForBar:numeric expr,Color:string)=> VAR MaxValue = MAXX(ALLSELECTED(ColumnForBar), MeasureForBar) VAR Width = 280 * MeasureForBar / MaxValue RETURN "data:image/svg+xml;utf8,<svg xmlns='http://www.w3.org/2000/svg' id='wujunmin' width='300' height='36' > <rect rx='2' x='10' y='16' width='280' height='4' fill='#f0f0f0'/> <rect rx='2' x='"& (300-Width)/2 & "' y='12' width='" & Width & "' height='12' fill='" & Color & "' stroke='none'/> <text x='150' y='8' text-anchor='middle' font-size='11' fill='#333333'> " & FORMAT(MeasureForBar,"#,##") & " </text> </svg>" e.g. Measure= SVG_Bar('store'[storeID],[M.KPI],"Deepskyblue") FUNCTION SVG_Progress_Bar = (PctMeasure:numeric,Color:string)=> "data:image/svg+xml;utf8,<svg xmlns='http://www.w3.org/2000/svg' width='200' height='30'> <path id='wujunmin' d='M0 15L200 15' stroke='" & Color & "' stroke-opacity='0.4' stroke-width='10' stroke-dasharray='2'/><path d='M0 15L" & 200 * PctMeasure & " 15' stroke='" & Color & "' stroke-width='10'/> </svg>" e.g. Measure = SVG_Progress_Bar([M.Pct],"brown") FUNCTION SVG_Gradient_Bar = (ColumnForBar:anyref,MeasureForBar:numeric expr,Color:string)=> VAR MaxValue = MAXX ( ALLSELECTED(ColumnForBar), MeasureForBar) VAR LinearGradient= " <defs> <linearGradient id='wujunmin'> <stop offset='0%' style='stop-color:white'/> <stop offset='100%' style='stop-color:" & Color & "'/> </linearGradient> </defs>" VAR SVG = " data:image/svg+xml;utf8, <svg xmlns='http://www.w3.org/2000/svg' width='200' height='30' > " & LinearGradient & " <rect rx='2' x='0' y='5' width='" & 200 * MeasureForBar / MaxValue & "' height='20' fill='url(#wujunmin)' /> </svg>" RETURN SVG e.g. Measure = SVG_Gradient_Bar('Store'[StoreID],[M.KPI],"Brown") FUNCTION SVG_Waffle = (PctMeasure:numeric,Color:string)=> VAR t = GENERATESERIES ( 1, 10 ) VAR tPlus = GENERATE ( SELECTCOLUMNS ( t, "Value1", [Value] ), t ) VAR tPlusPlus = ADDCOLUMNS ( tPlus, "Index", RANKX ( tPlus, [Value] + [Value1] / 100,, ASC ) ) VAR tWaffle = ADDCOLUMNS ( tPlusPlus, "circle", "<circle cx='" & [Value] * 10 -5 & "' cy='" & [Value1] * 10 -5 & "' r='4' fill='" & IF ( [Index] <= ROUND (PctMeasure * 100, 0 ), Color , "LightGrey" ) & "' />") RETURN "data:image/svg+xml;utf8,<svg xmlns='http://www.w3.org/2000/svg' id='wujunmin' width='100' height='100'> <g transform='rotate(-90,50,50)'>" & CONCATENATEX ( tWaffle, [circle] ) & "</g> </svg> " e.g. Measure = SVG_Waffle([M.Pct],IF([M.Pct]<0.5,"Brown","green")) FUNCTION SVG_Bubble = (ColumnForBubble:anyref,MeasureForBubble:numeric expr,Color:string)=> "data:image/svg+xml;utf8,<svg xmlns='http://www.w3.org/2000/svg' id='wujunmin' width='200' height='200'> <circle cx='100' cy='100' r='" & 100 * SQRT ( ABS ( MeasureForBubble ) / MAXX ( ALLSELECTED ( ColumnForBubble ), ABS ( MeasureForBubble ) ) ) & "' fill='" & Color & "'/> </svg>" e.g. Measure = SVG_Bubble('Store'[StoreID],[M.KPI],"Deepskyblue") --------------- HTML UDFs(HTML Content Visual) FUNCTION HTML_CircleBG_Text= (AnyText:string,BackgroundColor:string,TextColor:string)=> "<head> <style> p { font-size: 30px; color: white; font-weight: bold; line-height: 1; font-family: Arial, sans-serif; } .wujunmin { background-color: " & BackgroundColor & "; border-radius: 50%; margin: 3px; width: 60px; height: 60px; color: " & TextColor & "; display: inline-flex; align-items: center; justify-content: center; } </style> </head> <body> <p>" & CONCATENATEX( GENERATESERIES(1,LEN(AnyText)), "<span class='wujunmin'>" & MID(AnyText,[Value],1) & "</span>",,[Value],ASC ) & "</p> </body>" e.g. Measure = HTML_CircleBG_Text("wujunmin","Brown","Snow") FUNCTION HTML_Progress_Bar = (ColumnForPct:anyref,PctMeasure:numeric,Color:string)=> "<p style='font-size: 20px;background: linear-gradient(to right, " & Color & " " & FORMAT(PctMeasure,"0%") & ", lightgrey 0);border-radius: 20px;white-space: nowrap;padding-left:5px;'>" & SELECTEDVALUE(ColumnForPct) & " " & FORMAT(PctMeasure,"0%") & "</p>" e.g. Measure = HTML_Progress_Bar('Store'[StoreID],[M.Pct],"tomato") FUNCTION HTML_Bar_Ring = (ColumnForChart:anyref,MeasureForBar:numeric expr,MeasureForRing:numeric)=> VAR MaxSales = MAXX(ALLSELECTED(ColumnForChart), MeasureForBar) VAR SalesPercentage = MeasureForBar / MaxSales * 100 VAR AchievementRate = MeasureForRing VAR CityName = SELECTEDVALUE(ColumnForChart) VAR SalesFormatted = FORMAT(MeasureForBar, "#,#") VAR DonutChart = "<svg width='50' height='50' viewBox='0 0 42 42'> <circle cx='21' cy='21' r='15' fill='none' stroke='lightgrey' stroke-width='4'/> <circle cx='21' cy='21' r='15' fill='none' stroke='#2196F3' stroke-width='4' stroke-linecap='round' stroke-dasharray='" & AchievementRate * 100 & ",100' transform='rotate(-90 21 21)'/> <text x='21' y='26' font-family='Arial' font-size='10' text-anchor='middle' fill='#333'>" & FORMAT(AchievementRate, "0%") & "</text> </svg>" --公众号wujunmin VAR BarChart = "<div style='display: flex; align-items: center; width: 100%; gap: 10px;'> <div style='flex-shrink: 0;'>" & DonutChart & "</div> <div style='flex-grow: 1; position: relative;'> <div style='height: 30px; background: #f0f0f0; border-radius: 15px; overflow: hidden;'> <div style='height: 100%; width: " & SalesPercentage & "%; background: linear-gradient(90deg, #2196F3, #64B5F6); border-radius: 15px 0 0 15px; display: flex; align-items: center; padding-left: 15px; color: white; font-family: Arial; font-weight: bold; font-size: 15px;'> " & CityName & " " & SalesFormatted & " </div> </div> </div> </div>" RETURN BarChart e.g. Measure = HTML_Bar_Ring('Store'[StoreID],[M.Sales],[M.Pct])626Views1like2Comments[Interactive HTML Visual in Power BI] — Highlighted at the DataViz World Championships
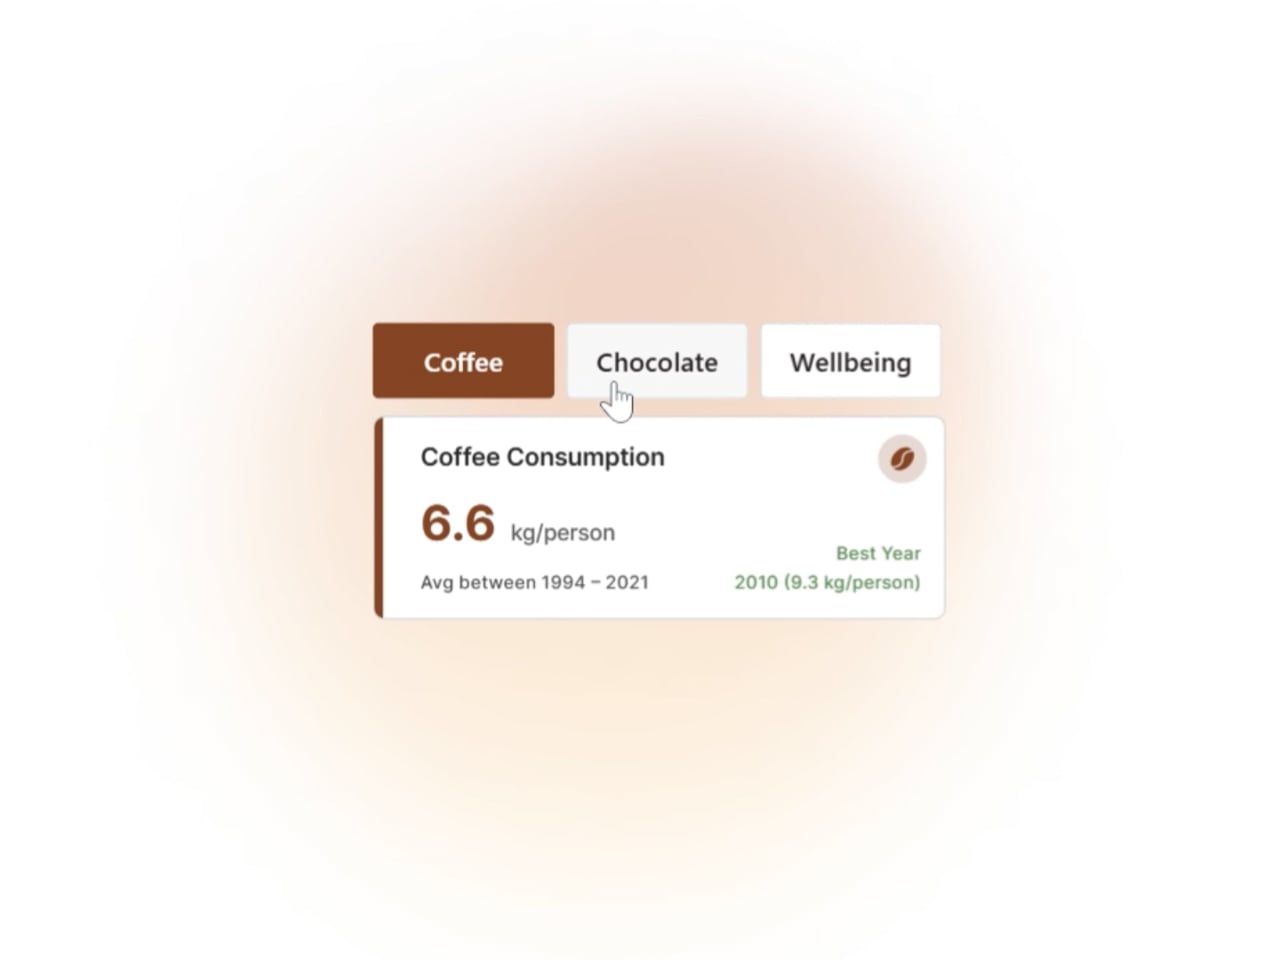
Hi everyone, I’d like to share one of the visuals that received great feedback from the Power BI community during the Power BI DataViz World Championships: an interactive HTML card that dynamically adapts to the selected parameter — changing colors, data, text, tooltips, and visual style, all within Power BI. This kind of solution is part of my regular workflow, especially when the goal is to enhance storytelling, accessibility, and user experience. It’s a way to make data consumption more intuitive and engaging, without compromising clarity or performance. The card was featured in a thematic report exploring coffee, chocolate, and wellbeing across Europe, and it stood out for its flexibility and visual impact. I’m considering starting a series of posts to share more examples, techniques, and practical tips for those interested in pushing the boundaries of HTML, CSS, and advanced interactivity in Power BI. If this type of content interests you, feel free to comment or reach out! I’d love to exchange ideas and learn from others in the community. Feel free to connect on Linkedin http://linkedin.com/in/paulogrijo
The module named 'Html' has been disabled in this context
Hey Guys, I am running a local power bi reporting server ( on-premises), one of my reports greps data from my company website ( hosted externally). After updating to October 2020, I noticed that the report schedule refresh fails to update data with error as shown: error details shows: [0] -1055784932: The module named 'Html' has been disabled in this context.. The exception was raised by the IDbCommand interface. [1] -1055784932: The module named 'Html' has been disabled in this context.. The exception was raised by the IDbCommand interface. On the other hand, I successfully refreshed the data when I opened the report using the powerBI desktop October 2020 with no errors. But still schedule refresh fails to update data11KViews1like9Comments
HTML External Visual Objects not displaying on a Public Report
Hello all, This is my first message in the forum c: I did not find any relevant information regarding the issue I am facing. I used multiple external visual objects for my report to display some HTML code. The idea of this visual is to display an audio player like this: I have already added and enabled these externals visuals to my organization as follows: When I open my report on the powerBI platform (Cloud), I am able to see the HTML visual correctly, Also when I shared the report to a Sharepoint space. However when I shared my report as a public web link, my HTML view turns like this. I know for a fact that this message only come up if you have not added the respective external visuals to your organization, but, that is not my case as I show you above. I tried this with all the HTML viewers and I get the same result for each. The links to the audio are hosted in a storage account in Azure. Thank you.Solved721Views0likes2Comments
Export to HTML not showing Graphs
Hi, So I've created a paginated report (in MS report builder) and uploaded to our server, the report contains two tables of data and a graph, which all works completely fine. The issue I am having is that I am trying to export this via a file share subscription as a HTML 4.0 document, which also exports fine however when it is exported, the two tables display fine however the graph does not, I have tried to google around for this but to no avail. Wonder if anyone can help, if I export it via email and attach as MHTML it works fine and I can everything as expeced.1.1KViews0likes2CommentsMailto in HTML in card browser visualization
Hi I am using HTML within "card browser" visualization in power BI. It includes a "mailto" link. The link does not work.. when I try wo the HTML (e.g. text box) it works ok. I can see the HTML command is correct. I suspect is related to the HTML in PBI. Anyone encountered something like this?1KViews0likes1CommentEmbed External Documentation (Confluence Cloud) to PBI Reports - SSAS Live Connection
Hi there, we provide our documentation for pbi reports via confluence cloud. Our goal is to show the appropriate page directly in the pbi report via iFrame. Fortunately we still have the html viewer addon available, but a report level measure (defined as text and web-url) will not be accepted by the visual ;-( Due to SSAS live connection it is not possible for us pbi developers to create tables within a report. Adding the urls via SSAS/Visual Studio seems a bit too much, though url changes may occur and are not as easy to fix as within the report itself. Any ideas? Highly appreciated. Thx.721Views0likes0Comments
power bi html page unbounded from report server
hello everybody. installed PBRS developer, everything is nice so far. thinking about how to create power bi html page unbounded from report server - to have interactive isolated html page based on a snapshot of the data. apparantely if to get all the libraries and replace calls to return static data the task seems to be feasible. but perhaps there are easier ways - please advice. thanks in advance.754Views1like0Comments