dataviz
4 TopicsPower BI Desktop End-to-End Solution
𝗣𝗼𝘄𝗲𝗿 𝗕𝗜 𝗗𝗲𝘀𝗸𝘁𝗼𝗽 𝗘𝗻𝗱-𝘁𝗼-𝗲𝗻𝗱 𝗦𝗼𝗹𝘂𝘁𝗶𝗼𝗻 𝗙𝗿𝗼𝗺 𝗘𝘅𝗰𝗲𝗹 𝘁𝗼 𝗦𝘁𝘂𝗻𝗻𝗶𝗻𝗴 𝗣𝗼𝘄𝗲𝗿 𝗕𝗜 𝗙𝗶𝗻𝗮𝗻𝗰𝗶𝗮𝗹 𝗥𝗲𝗽𝗼𝗿𝘁. Learn how to turn your Excel data into a powerful, visually appealing financial report with Power BI Desktop. 𝗧𝗵𝗶𝘀 𝗙𝗥𝗘𝗘 𝘁𝗿𝗮𝗶𝗻𝗶𝗻𝗴 𝗴𝘂𝗶𝗱𝗲𝘀 𝘆𝗼𝘂 𝘀𝘁𝗲𝗽-𝗯𝘆-𝘀𝘁𝗲𝗽 𝘁𝗵𝗿𝗼𝘂𝗴𝗵 𝗰𝗼𝗻𝗻𝗲𝗰𝘁𝗶𝗻𝗴, 𝘁𝗿𝗮𝗻𝘀𝗳𝗼𝗿𝗺𝗶𝗻𝗴, 𝗮𝗻𝗱 𝘃𝗶𝘀𝘂𝗮𝗹𝗶𝘇𝗶𝗻𝗴 𝘆𝗼𝘂𝗿 𝗱𝗮𝘁𝗮, 𝗺𝗮𝗸𝗶𝗻𝗴 𝗶𝘁 𝗲𝗮𝘀𝘆 𝘁𝗼 𝗰𝗿𝗲𝗮𝘁𝗲 𝗽𝗿𝗼𝗳𝗲𝘀𝘀𝗶𝗼𝗻𝗮𝗹 𝗶𝗻𝘀𝗶𝗴𝗵𝘁𝘀. 𝗘𝘅𝗽𝗲𝗰𝘁𝗲𝗱𝗢𝘂𝘁𝗽𝘂𝘁: Up and Running Power BI Desktop End-to-End Financial Report 𝗦𝗰𝗵𝗲𝗱𝘂𝗹𝗲: Date: November 29, 2024 (Friday) Time: 7:00PM to 10:00PM PH Time Venue: 100% Online via Data Analytics Philippines FB Page 𝗕𝗲𝗻𝗲𝗳𝗶𝘁𝘀: + 𝟭𝟬𝟬% 𝗙𝗥𝗘𝗘𝗧𝗿𝗮𝗶𝗻𝗶𝗻𝗴𝘄𝗶𝘁𝗵 𝗲-𝗖𝗘𝗥𝗧𝗜𝗙𝗜𝗖𝗔𝗧𝗘 + LIVE Training + Instructor-led + Beginner-friendly + Open to EveryJuan + FREE Power BI Template and Dataset Click to View the details3KViews0likes0Comments
Evento Presencial Power BI
Maria José Pons realizará una exposición hablando sobre el uso de PowerBI fuera del ámbito financiero. Concretamente, su enfoque está orientado al mundo del deporte a la mejora del rendimiento de un equipo profesional de futbol. Houssein Laftouh realizará la segunda ponencia de la jornada, en este caso hablará sobre las nuevas funcionalidades Dax View y TMDL View para ayudar a la mejorar la productividad y rendimiento.2.8KViews0likes0Comments[Interactive HTML Visual in Power BI] — Highlighted at the DataViz World Championships
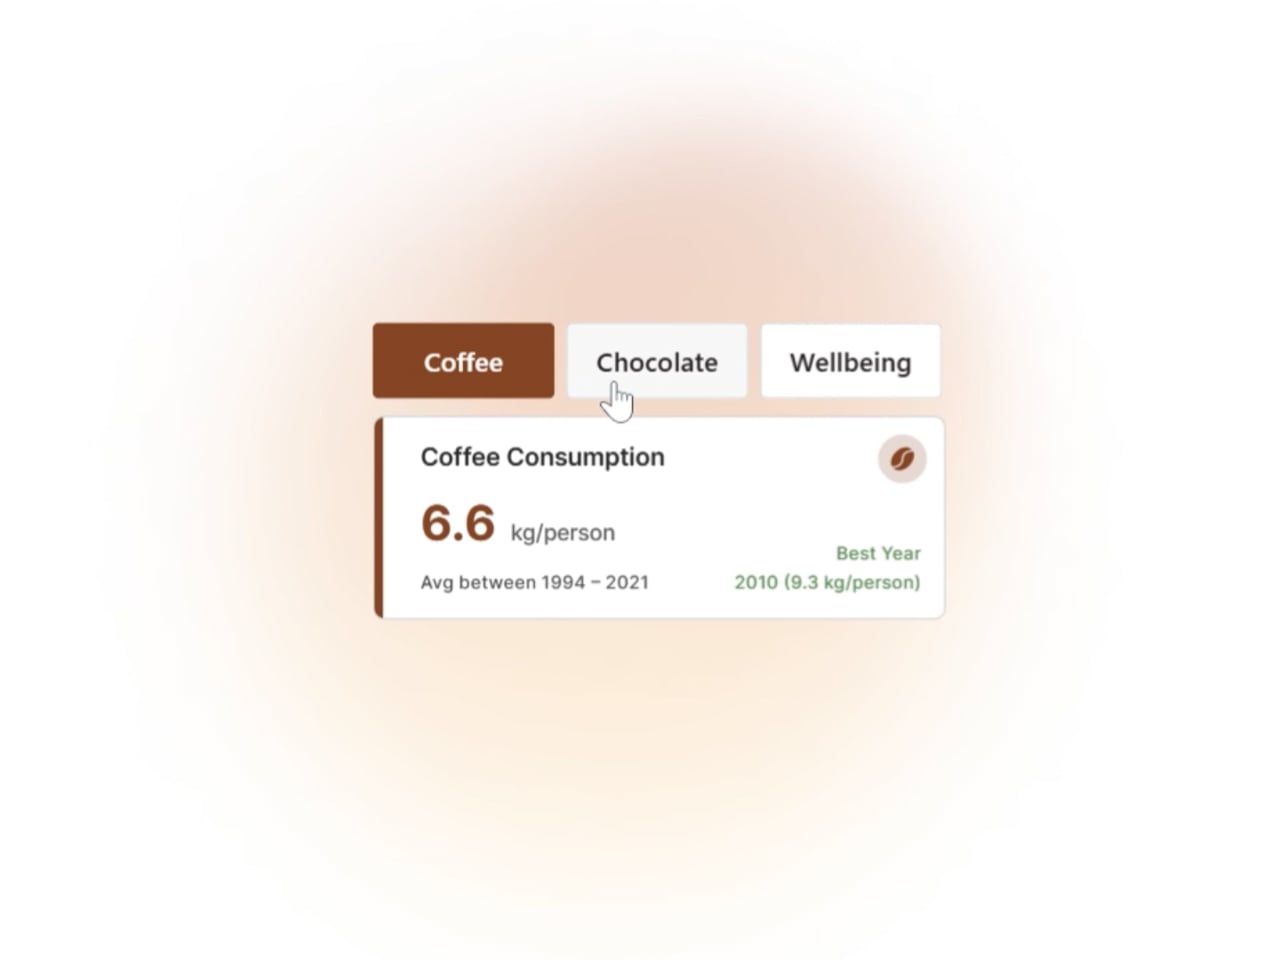
Hi everyone, I’d like to share one of the visuals that received great feedback from the Power BI community during the Power BI DataViz World Championships: an interactive HTML card that dynamically adapts to the selected parameter — changing colors, data, text, tooltips, and visual style, all within Power BI. This kind of solution is part of my regular workflow, especially when the goal is to enhance storytelling, accessibility, and user experience. It’s a way to make data consumption more intuitive and engaging, without compromising clarity or performance. The card was featured in a thematic report exploring coffee, chocolate, and wellbeing across Europe, and it stood out for its flexibility and visual impact. I’m considering starting a series of posts to share more examples, techniques, and practical tips for those interested in pushing the boundaries of HTML, CSS, and advanced interactivity in Power BI. If this type of content interests you, feel free to comment or reach out! I’d love to exchange ideas and learn from others in the community. Feel free to connect on Linkedin http://linkedin.com/in/paulogrijo
I need a help with a histogramme empilé
I would like to put two indicators from two companies (4 in total) on the same histogram. I thought about a unique stacked histogram with two columns, each for one indicator, which cumulates the results of both companies. But I really don't know how to create two columns for a 'stacked histogram.' Could you help me? Or maybe you have other ideas for my visualization? In any case, thanks a lot.509Views0likes1Comment