Join us at FabCon Vienna from September 15-18, 2025
The ultimate Fabric, Power BI, SQL, and AI community-led learning event. Save €200 with code FABCOMM.
Get registered- Power BI forums
- Get Help with Power BI
- Desktop
- Service
- Report Server
- Power Query
- Mobile Apps
- Developer
- DAX Commands and Tips
- Custom Visuals Development Discussion
- Health and Life Sciences
- Power BI Spanish forums
- Translated Spanish Desktop
- Training and Consulting
- Instructor Led Training
- Dashboard in a Day for Women, by Women
- Galleries
- Data Stories Gallery
- Themes Gallery
- Contests Gallery
- Quick Measures Gallery
- Notebook Gallery
- Translytical Task Flow Gallery
- TMDL Gallery
- R Script Showcase
- Webinars and Video Gallery
- Ideas
- Custom Visuals Ideas (read-only)
- Issues
- Issues
- Events
- Upcoming Events
Enhance your career with this limited time 50% discount on Fabric and Power BI exams. Ends August 31st. Request your voucher.
- Power BI forums
- Galleries
- Webinars and Video Gallery
- Fast Break 06: Designing an Interactive Report wit...
Fast Break 06: Designing an Interactive Report with R Visuals
03-15-2017 11:18 AM - last edited 03-15-2017 21:18 PM


- Mark as New
- Bookmark
- Subscribe
- Mute
- Subscribe to RSS Feed
- Permalink
- Report Inappropriate Content
Fast Break 06: Designing an Interactive Report with R Visuals
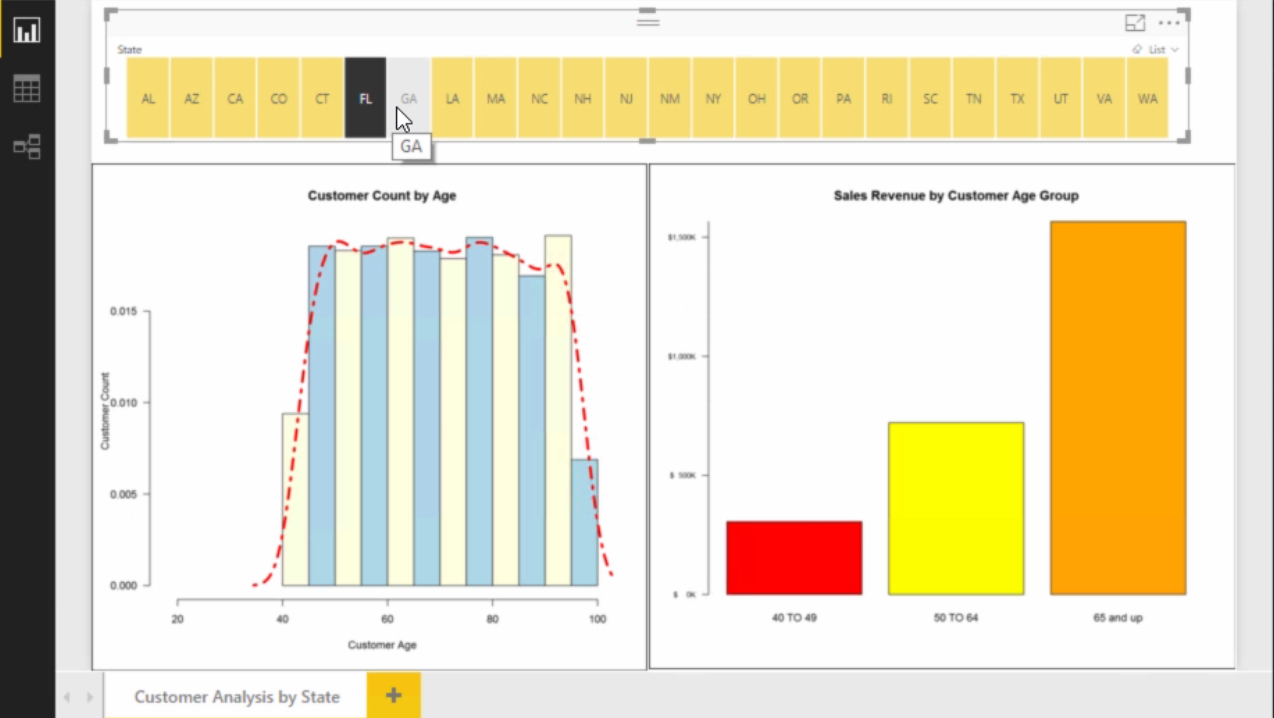
Learn how to add and customize R visuals in a Power BI Desktop report.
This video is one in a series of 8 videos titled Fast Break in Power BI. Make sure to check out all the other videos in this series.
- 01 Using Binning and Grouping in Power BI Desktop
- 02 Querying Data from an Unstructured Text File
- 03 Creating Lookup Tables using DAX
- 04 Creating a Calendar Table using DAX
- 05 Writing an R Script to Extract a CSV File From a Zip Archive
- 06 Designing an Interactive Report with R Visuals
- 07 Creating and Testing Your First Custom Visual
- 08 Creating a Custom Visual using the D3 Library
watch?v=2-Ae4myfscM