Advocate IV
Annotating Specific Events in Line Charts
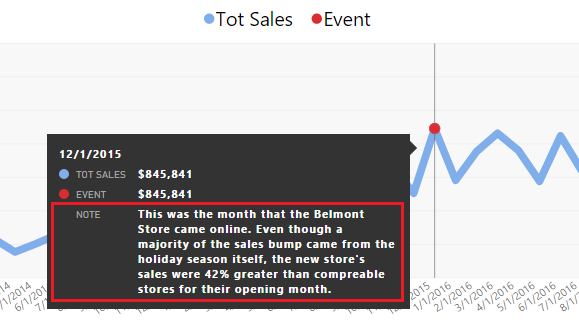
In this video we're going to show you to add annotations for specific events in your line chart lettings you add historical context to specific data points.
This is the simple version that keeps your model nice and clean. Expect another video in the not too distant future letting you populate these annotations from a factAnnotations table using CONCATONATEX().
Happy Reporting!
watch?v=6OgJX21cgMg
4 Replies
 AnonymousNot applicable
Love the report title. Thanks for posting this, I didn't expect to actually find anything when I google searched ways to annotate, pleasantly surprised and it's a small world!
- AnonymousNot applicable
Hi Brian thanks for this, this is awesome! I was wondering if there was a way to do this when adding a field to the Legend tab to have multiple lines for lets say, channel in my example. Is that possible?
- AnonymousNot applicable
Thanks for this. is there an option to show the events on the chart as data labels? Instead of tool tips?
- FireFighter1017
Advocate III
Is there an up-to-date version of this?