Join us at the 2025 Microsoft Fabric Community Conference
Microsoft Fabric Community Conference 2025, March 31 - April 2, Las Vegas, Nevada. Use code FABINSIDER for a $400 discount.
Register nowGo To
- Power BI forums
- Get Help with Power BI
- Desktop
- Service
- Report Server
- Power Query
- Mobile Apps
- Developer
- DAX Commands and Tips
- Custom Visuals Development Discussion
- Health and Life Sciences
- Power BI Spanish forums
- Translated Spanish Desktop
- Training and Consulting
- Instructor Led Training
- Dashboard in a Day for Women, by Women
- Galleries
- Webinars and Video Gallery
- Data Stories Gallery
- Themes Gallery
- Power BI DataViz World Championships Gallery
- Quick Measures Gallery
- R Script Showcase
- COVID-19 Data Stories Gallery
- Community Connections & How-To Videos
- 2021 MSBizAppsSummit Gallery
- 2020 MSBizAppsSummit Gallery
- 2019 MSBizAppsSummit Gallery
- Events
- Ideas
- Custom Visuals Ideas (read-only)
- Issues
- Issues
- Events
- Upcoming Events
Turn on suggestions
Auto-suggest helps you quickly narrow down your search results by suggesting possible matches as you type.
Showing results for
The Power BI DataViz World Championships are on! With four chances to enter, you could win a spot in the LIVE Grand Finale in Las Vegas. Show off your skills.
- Power BI forums
- Galleries
- Themes Gallery
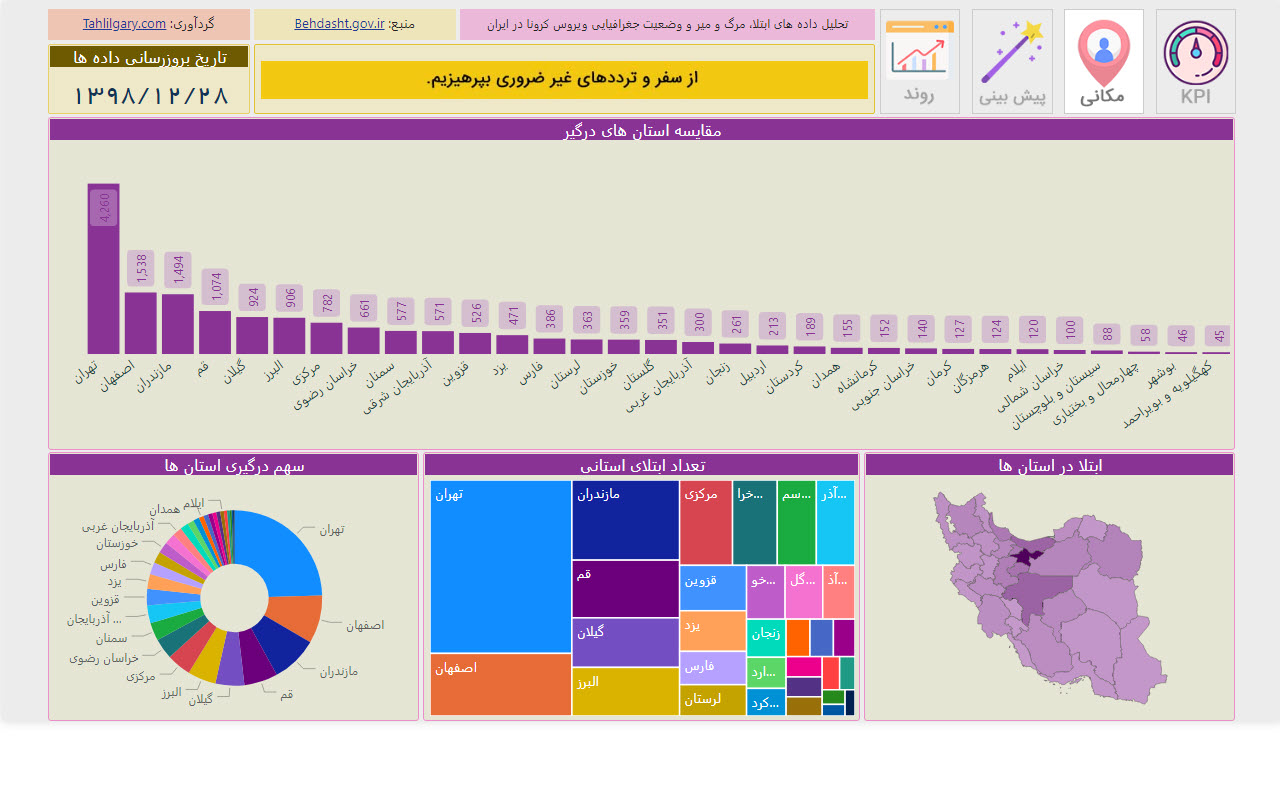
- Covid19 in Iran


- Mark as New
- Bookmark
- Subscribe
- Mute
- Subscribe to RSS Feed
- Permalink
- Report Inappropriate Content
- Mark as New
- Bookmark
- Subscribe
- Mute
- Subscribe to RSS Feed
- Permalink
- Report Inappropriate Content
06-26-2020
01:13 AM
Great theme! How did you make this visual? is it many graphs or just one? Thank you for the info!

- Mark as New
- Bookmark
- Subscribe
- Mute
- Subscribe to RSS Feed
- Permalink
- Report Inappropriate Content
11-26-2023
02:30 AM
No, This is a table with sparlink rows.
- Mark as New
- Bookmark
- Subscribe
- Mute
- Subscribe to RSS Feed
- Permalink
- Report Inappropriate Content
06-24-2020
06:46 AM
Excellent job! 👍