I have a dataset which among other things defines colors which should be applied to columns in the visual.
This works really well in PBI desktop (and R Studio) but when I publish the report to powerbi.com the order of the colors is wrong (the columns get the wrong color).
At first it looked like the colors were sorted in alphabetical order but I was unable to reproduce that.
Using color names produced the same result as using the hex codes.
I have created a small DAX script to create test tables:
ColourNames = DataTable (
  "FillColour", string,
  "Value", integer,
  "xLabel", integer,
  {
    { "Red",  50, 1 },
    { "Gold", 30, 2 },
    { "Red",  10, 3 },
    { "Gray", 40, 4 },
    { "Red",  20, 5 }
  }
)

ColourHexes = DataTable (
  "FillColour", string,
  "Value", integer,
  "xLabel", integer,
  {
    { "#ff0000", 50, 1 },
    { "#ffd700", 30, 2 },
    { "#ff0000", 10, 3 },
    { "#bebebe", 40, 4 },
    { "#ff0000", 20, 5 }
  }
)
The R script for the visual is:
library(ggplot2)
ggplot( dataset, aes( x = xLabel, y = Value ) ) +
    geom_col ( fill = dataset$FillColour )
This is what the graph shold look like (and what it looks like in PBI desktop)...
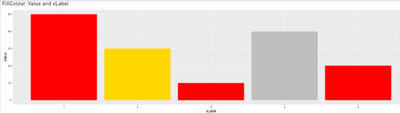
but in the service it looks like this.

I'm running version 2.102.845.0 64-bit of PBI desktop.
Am I doing something wrong here or is this a bug in the service?
Regards,
Steini


