Forum Discussion

OneWithQuestion Post Prodigy
9 years agoPost ProdigyLine chart with shaded area?
I would like to make a chart like this: Where there is a shaded goal area, and then a line. The goal area is NOT hard coded, it needs to be set be mapped against a measure. In the abov...


v-caliao-msft Microsoft Employee
9 years agoMicrosoft EmployeeHi OneWithQuestion,
I have tested it on my local environment using the sample data below.
We can get the expected result like below.
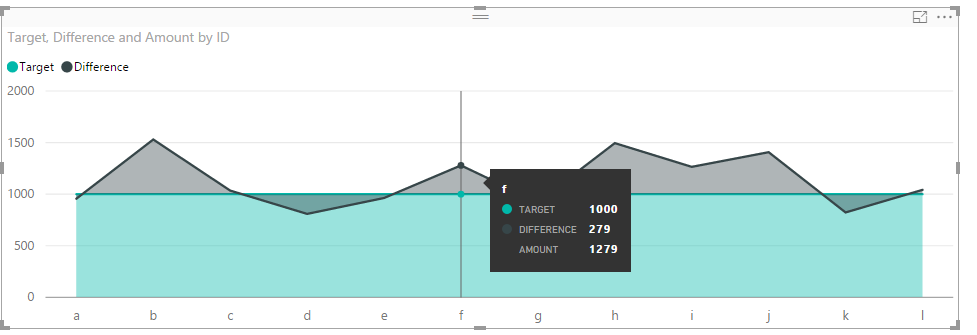
Regards,
Charlie Liao

OneWithQuestionPost Prodigy
9 years agoPost ProdigySadly, that still shows a shaded area under the line.
Ideally one would be a line and the other would be a shaded area (or column bar chart with adjusted gap width)
- v-caliao-msft9 years ago
Hi OneWithQuestion,
Currently, this the closest workaround we can achieve in Power BI, if this is not what you want, you can create a custom visual to achieve it if you have rich experience in coding.
Regards,
Charlie Liao