Forum Discussion

 Advocate I
Having an issue witht the Matrix visualization and PowerBI Analysis Services Connector
Hi,
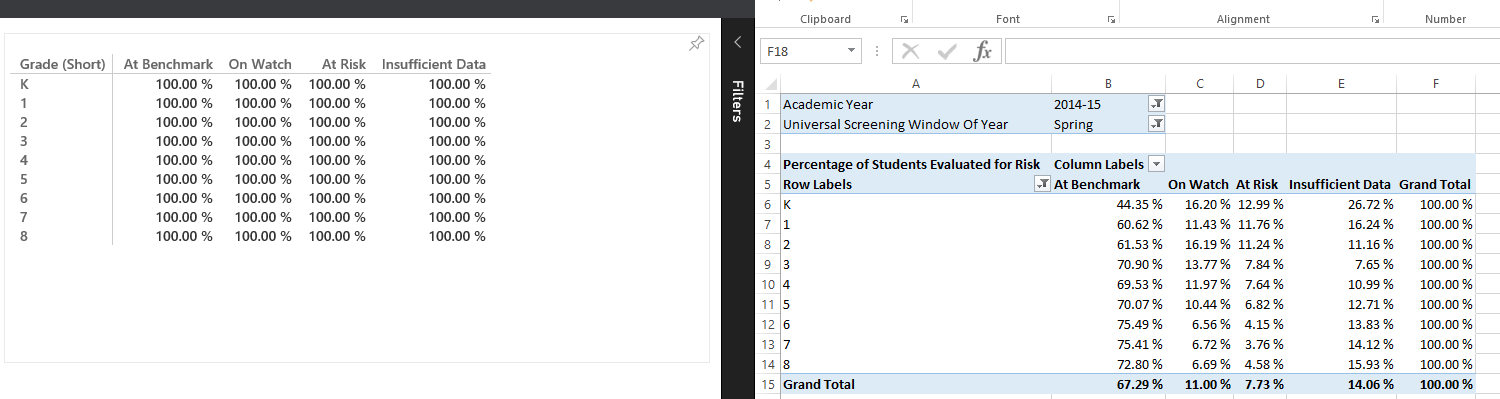
I'm not sure if this is a bug or not, but I'm having a problem with the Matrix visualization. When I run a visualization in excel, the calculation runs correclty, but in PowerBI every cell shows up as 100%.
Is there a way to attach screenshots to these posts?
Jason
4 Replies
 JasonMiles
I should add that this only seems to be happening with percentage calculations that implement the "ALL('Table'[Column])" pattern. It works correctly with all other calculations.
- Greg_Deckler
Community Champion
Yes, save the screen shot as a file (png, jpg, etc.) and then you can use the little toolbar when editing a post to attach a picture from a file. 9th icon from the left.
- JasonMiles
These two visualizations should be the same. The filters are the same and I'm using the same measure.
- JasonMiles
OK, after further research, the same issue seems to be coming up whenever I use the ALL('TableName'[ColumnName]',...) pattern with lots of columns. Is anyone else seeing this, or do I need to find another way to do this calculation?