Forum Discussion

Graph two columns on same axis

 Anonymous7 years ago
Ok so let me clarify:
A Sales Rep has sales and manager.
A Sales Rep's sales are his sales only.
A Sales Manager is his sales plus the sales of any Sales Rep below him. Is that correct?
If thats the case, you'd need to create a measure that does 2 sums and adds them together. The first sum would simply be "Sales with my name on it" and the second would be "Sales where I'm the manager".
Now Sales Reps will always be 0 for that second one, so it should work fine. Sales Managers who don't actually sell will be 0 for the first one. Overall you should get the right number and you can then place this onto the same Axis. The only thing you'll need is a list of Employees to act as your Axis.

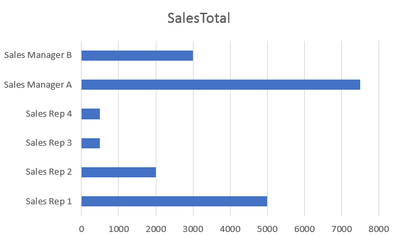
Please see below, trying to compare both sales manager and sales rep in the same chart side by side.

Hi acbg,
Based on your information, it seems that the sales total of Sales Manager A is 7500, it seems that is the sum of 5000+2000+500.
I'm a little confused about this result. I think the sales total of Sales Manager A should be Sales Rep 2+Sales Rep 1=7000.
Could you describe your logic in more details?
Best Regards,
Cherry
- acbg7 years agoResolver III
sorry graph was created early on and data was just something sample I put together.