Go To
- Power BI forums
- Updates
- News & Announcements
- Get Help with Power BI
- Desktop
- Service
- Report Server
- Power Query
- Mobile Apps
- Developer
- DAX Commands and Tips
- Custom Visuals Development Discussion
- Health and Life Sciences
- Power BI Spanish forums
- Translated Spanish Desktop
- Power Platform Integration - Better Together!
- Power Platform Integrations (Read-only)
- Power Platform and Dynamics 365 Integrations (Read-only)
- Training and Consulting
- Instructor Led Training
- Dashboard in a Day for Women, by Women
- Galleries
- Community Connections & How-To Videos
- COVID-19 Data Stories Gallery
- Themes Gallery
- Data Stories Gallery
- R Script Showcase
- Webinars and Video Gallery
- Quick Measures Gallery
- 2021 MSBizAppsSummit Gallery
- 2020 MSBizAppsSummit Gallery
- 2019 MSBizAppsSummit Gallery
- Events
- Ideas
- Custom Visuals Ideas
- Issues
- Issues
- Events
- Upcoming Events
- Community Blog
- Power BI Community Blog
- Custom Visuals Community Blog
- Community Support
- Community Accounts & Registration
- Using the Community
- Community Feedback
Turn on suggestions
Auto-suggest helps you quickly narrow down your search results by suggesting possible matches as you type.
Showing results for
Register now to learn Fabric in free live sessions led by the best Microsoft experts. From Apr 16 to May 9, in English and Spanish.
- Power BI forums
- Galleries
- Quick Measures Gallery
- Running Max/Min/Avg of Running Total


Anonymous
Not applicable
- Mark as New
- Bookmark
- Subscribe
- Mute
- Subscribe to RSS Feed
- Permalink
- Report Inappropriate Content
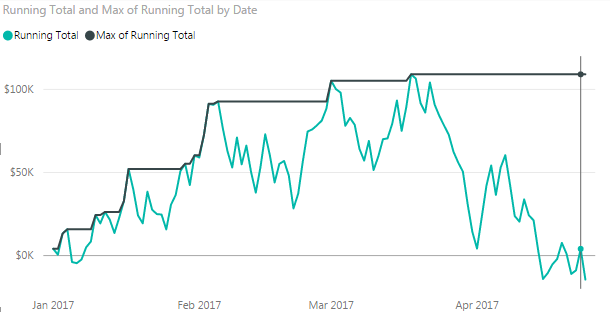
Running Max/Min/Avg of Running Total
04-25-2017
09:34 AM
This measure calculates the running max/min/average (depending on your requirement) of a running total based on the dynamic date range selected.
To recap, here is the Running Total quick measure that Power BI gives us. A measure like this should be be present in your model.
Running Total :=
CALCULATE(
	'Sales'[Amount],
	FILTER(
		ALLSELECTED('Date'[Date]),
		ISONORAFTER('Date'[Date], MAX('Date'[Date]), DESC)
	)
)
Below is an example of how to set up a running MAX of the running total shown above:
Max of Running Total :=
VAR __INTERIM_CALC =
    ADDCOLUMNS (
        SUMMARIZE ( ALLSELECTED ( 'Date' ), 'Date'[Date] ),
        "__RunningTotal", [Running Total]
    )
RETURN
    MAXX (
        FILTER (
            __INTERIM_CALC,
            ISONORAFTER ( 'Date'[Date], MAX ( 'Date'[Date] ), DESC )
        ),
        [__RunningTotal]
    )
To find the running average/minimum/etc. of the running total, just change the MAXX in the above query to AVERAGEX, MINX, or another AGGX function.