skip to main content
Power BI
    • What is Power BI
    • Why Power BI
    • Customer stories
    • Data visuals
    • Security
    • Power BI Desktop
    • Power BI Pro
    • Power BI Premium
    • Power BI Mobile
    • Power BI Embedded
    • Power BI Report Server
  • Pricing
    • Azure + Power BI
    • Microsoft 365 + Power BI
    • Dynamics 365 + Power BI
      • Energy
      • Healthcare
      • Manufacturing
      • Media
      • Retail
    • For analysts
    • For IT
      • Overview
      • Embedded analytics
      • Power BI visuals
      • Automation
      • Documentation
      • Community
    • Overview
    • Find consulting services
    • Partner showcase
    • Find a partner
    • Become a partner
    • Instructor-led training
    • Getting started
      • Overview
      • Online workshops
      • Self-guided learning
      • Webinars
      • Documentation
      • Roadmap
      • Overview
      • Issues
      • Give feedback
    • Blog
    • Business intelligence topics
    • Overview
    • Forums
    • Galleries
    • Submit ideas
    • Events
    • User groups
    • Community blog
    • Register
    • ·
    • Sign in
    • ·
    • Help
    Go To
    • Microsoft Power BI Community
    • Welcome to the Community!
    • News & Announcements
    • Get Help with Power BI
    • Desktop
    • Service
    • Report Server
    • Power Query
    • Mobile Apps
    • Developer
    • DAX Commands and Tips
    • Custom Visuals Development Discussion
    • Health and Life Sciences
    • Power BI Spanish Community
    • Translated Spanish Desktop
    • Power Platform Integration - Better Together!
    • Power Platform Integrations
    • Power Platform and Dynamics 365 Integrations
    • Training and Consulting
    • Instructor Led Training
    • Galleries
    • Community Connections & How-To Videos
    • COVID-19 Data Stories Gallery
    • Themes Gallery
    • Data Stories Gallery
    • R Script Showcase
    • Webinars and Video Gallery
    • Quick Measures Gallery
    • 2021 MSBizAppsSummit Gallery
    • 2020 MSBizAppsSummit Gallery
    • 2019 MSBizAppsSummit Gallery
    • Events
    • Ideas
    • Custom Visuals Ideas
    • Issues
    • Issues
    • Events
    • Upcoming Events
    • Community Engagement
    • T-Shirt Design Challenge 2023
    • Community Blog
    • Power BI Community Blog
    • Custom Visuals Community Blog
    • Community Support
    • Community Accounts & Registration
    • Using the Community
    • Community Feedback
    cancel
    Turn on suggestions
    Auto-suggest helps you quickly narrow down your search results by suggesting possible matches as you type.
    Showing results for 
    Search instead for 
    Did you mean: 
    • Microsoft Power BI Community
    • Galleries
    • Quick Measures Gallery
    • Matrix Measure Total Triple Threat Rock & Roll

    Matrix Measure Total Triple Threat Rock & Roll

    05-06-2018 16:57 PM - last edited 05-06-2018 17:01 PM

    Super User Greg_Deckler
    Super User
    30657 Views
    LinkedIn LinkedIn Facebook Facebook Twitter Twitter
    Greg_Deckler
    Super User Greg_Deckler
    Super User
    • Mark as New
    • Bookmark
    • Subscribe
    • Mute
    • Subscribe to RSS Feed
    • Permalink
    • Print
    • Report Inappropriate Content

    Matrix Measure Total Triple Threat Rock & Roll

    ‎05-06-2018 04:57 PM

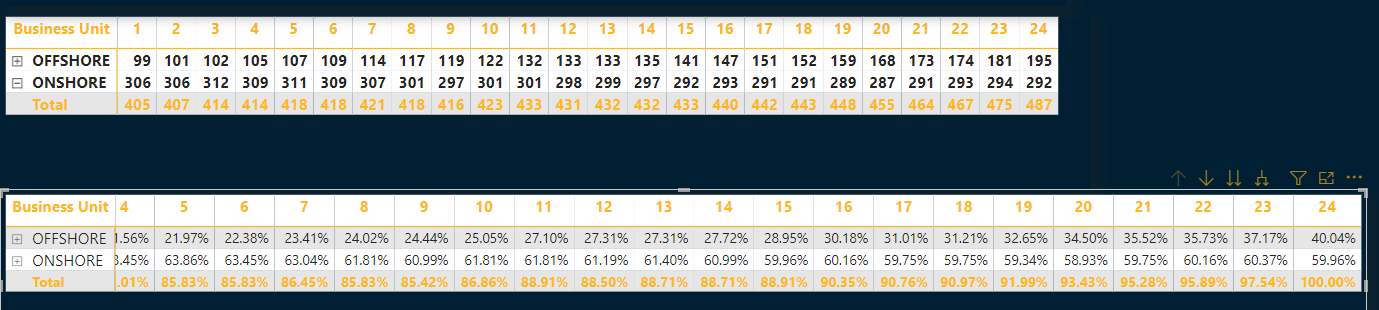
    While it would be a bit presumptuous to presume that any single formula could account for all possible measure total situations, the following pattern is presented for handling matrix measure values as well as subtotals and grand totals. This pattern has the added flexibility of being able to handle the same or different aggregation calculations at all three levels. In the example provided, the "normal" aggregation is MIN while at the the subtotal level it is the AVERAGE of those MIN values. At the grand total level, it is the MAX of the AVERAGE of the subtotals.


    Overall, this pattern provides extreme flexibility and can be extended to any number of level subtotals.


    The main assumption is that there is a "normal aggregation" measure that one is wishing to display in a matrix with correct subtotals and grand total. In this example, the formula for this normal aggregation is "Normal Aggregation = MIN('Table'[Occupancy %]).


    MM3TR&R = 
    VAR __Category1 = MAX([Category1])
    VAR __tmpTable =  SUMMARIZE(
                          ALLSELECTED('Table'),
                          'Table'[Category1],
                          'Table'[Category2],
                          "Aggregation",[Normal Aggregation]
                      )
    VAR __SubTotal =  
        AVERAGEX(
            FILTER(
                __tmpTable,
                'Table'[Category1]=__Category1
            ),
            [Aggregation]
        )
    VAR __GrandTotal =  
                MAXX(
                    GROUPBY(
                        __tmpTable,
                        [Category1],
                        "GTAggregation",
                        AVERAGEX(CURRENTGROUP(),[Aggregation])
                    ),
                    [GTAggregation]
                )
    RETURN IF(
                HASONEVALUE('Table'[Category1]) && HASONEVALUE('Table'[Category2]),
                [Normal Aggregation],
                IF(HASONEVALUE('Table'[Category1]),
                    __SubTotal,
                    __GrandTotal
                )
            )


    eyJrIjoiNzMyYTYwY2QtMGVlMC00MjdmLWIwNDUtYmQ1ZDFjNWZiM2E5IiwidCI6IjRhMDQyNzQzLTM3M2EtNDNkMi04MjdiLTAwM2Y0YzdiYTFlNSIsImMiOjN9


    @ me in replies or I'll lose your thread!!!
    Instead of a Kudo, please vote for this idea
    Become an expert!: Enterprise DNA
    External Tools: MSHGQM
    YouTube Channel!: Microsoft Hates Greg
    Latest book!:
    Mastering Power BI 2nd Edition

    DAX is easy, CALCULATE makes DAX hard...
    MM3TR&R.pbix
    1769 KB
    Labels:
    • Labels:
    • Totals
    Message 1 of 4
    30,657 Views
    9
    Reply
    • All forum topics
    • Previous Topic
    • Next Topic
    luzsoulez
    luzsoulez
    Frequent Visitor
    • Mark as New
    • Bookmark
    • Subscribe
    • Mute
    • Subscribe to RSS Feed
    • Permalink
    • Print
    • Report Inappropriate Content

    ‎06-23-2022 05:16 AM

    Hi! the matrix with numbers is working fine, but when I try to present it as % the values come wrong because it is calculating based on the last value instead of period over period. how can I solve this? It is using 487 total from period 24 to calculate all the periods %

    luzsoulez_0-1655986503363.png


    47 KB
    Message 4 of 4
    5,114 Views
    0
    Reply
    Anonymous
    Not applicable
    • Mark as New
    • Bookmark
    • Subscribe
    • Mute
    • Subscribe to RSS Feed
    • Permalink
    • Print
    • Report Inappropriate Content

    ‎01-09-2020 08:30 AM

    Do the formula work between two related tables?

    Thanks for your help

    Message 2 of 4
    23,783 Views
    0
    Reply
    TheCAKurtle
    TheCAKurtle Helper I
    Helper I
    In response to Anonymous
    • Mark as New
    • Bookmark
    • Subscribe
    • Mute
    • Subscribe to RSS Feed
    • Permalink
    • Print
    • Report Inappropriate Content

    ‎04-27-2020 09:58 AM

    @Greg_Deckler 

    Does this work for 2 fact tables that have 2 different dimensions connected to both? 
    So in my case the UWI column in BLOPS Dim is Category 1 and HierarchyCC column in Hierarchy Cost Centers is Category 2. 


    Thank you for the informative post!! 

     Annotation 2020-04-27 105710.png

    Message 3 of 4
    21,959 Views
    0
    Reply

    Power Platform

    • Overview
    • Power BI
    • Power Apps
    • Power Pages
    • Power Automate
    • Power Virtual Agents

    • Sign in
    • Sign up

    Browse

    • Solutions
    • Partners
    • Consulting Services

    Downloads

    • Power BI Desktop
    • Power BI Mobile
    • Power BI Report Server
    • See all downloads

    Learn

    • Guided learning
    • Documentation
    • Support
    • Community
    • Give feedback
    • Webinars
    • Developers
    • Blog
    • Newsletter

    © 2023 Microsoft

    Follow Power BI

    • Privacy & cookies
    • Manage cookies
    • Terms of use
    • Trademarks
    Consumer Privacy Act (CCPA) Opt-Out Icon Your Privacy Choices